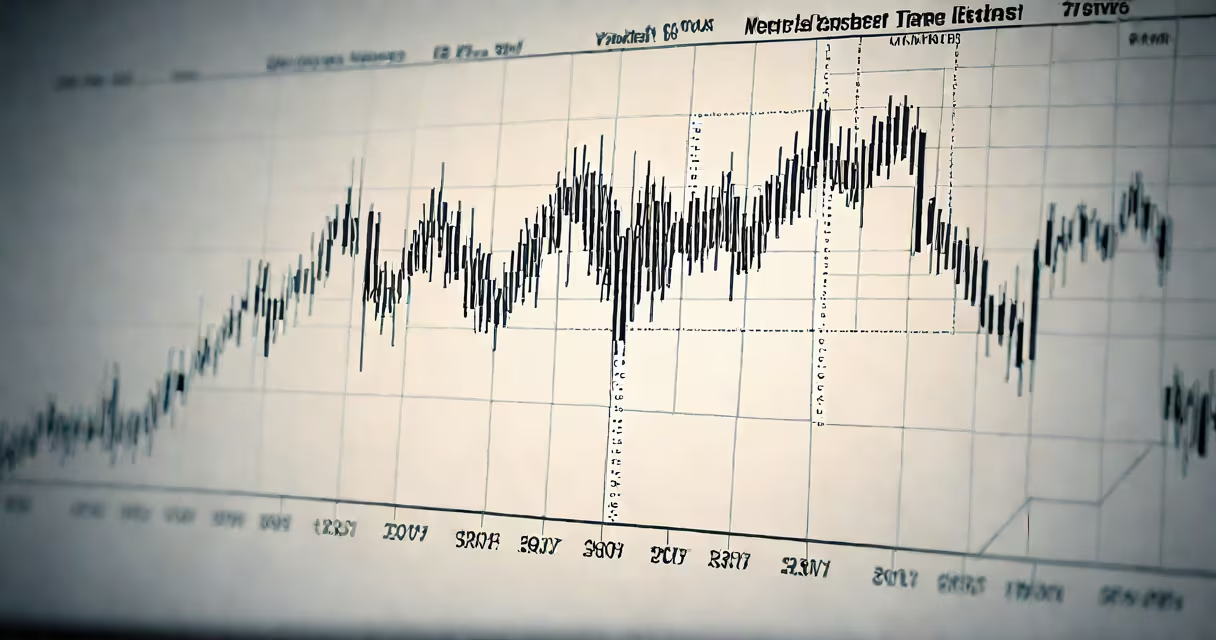
Stocks beaten down are publicly traded equities that have declined sharply in price due to short-term negative events, often creating buying opportunities for investors who believe the drop is disproportionate to long-term fundamentals.
These stocks typically trade below their historical averages, book value, or estimated fair value. The decline may stem from earnings misses, sector-wide turmoil, management changes, or macroeconomic shocks-not necessarily because the company's underlying business has deteriorated.
For example, in early 2022, semiconductor stocks plunged amid supply chain disruptions and rising interest rates. Many companies in the sector maintained strong balance sheets and long-term growth trajectories, yet share prices fell 40-60% in months. Investors who recognized this disconnect began accumulating positions, leading to significant gains when markets stabilized in late 2023.
When a stock drops rapidly, investor sentiment often shifts. This emotional reaction drives selling pressure, pushing prices below what analysts consider fair value. The gap between current price and intrinsic value creates a margin of safety-a buffer against further losses.
Valuation metrics such as price-to-earnings (P/E), price-to-book (P/B), and enterprise value to EBITDA (EV/EBITDA) help quantify this gap. A P/E ratio below the industry average, especially when earnings remain stable, signals potential undervaluation.
Consider a company with $1 billion in annual revenue, $200 million in net income, and 100 million shares outstanding. Its earnings per share (EPS) are $2.00. If the stock trades at $20 per share, the P/E is 10. The S&P 500's average P/E is around 20. A P/E of 10 suggests the stock may be undervalued-especially if earnings are expected to grow.
Stocks beaten down fall into distinct categories based on cause and recovery likelihood:
| Type | Trigger | Recovery Timeline | Example |
|---|---|---|---|
| Event-driven | Product recall, lawsuit, regulatory action | Short-term (3-12 months) | Johnson & Johnson (JNJ) after 2019 talcum powder lawsuits |
| Cyclical | Economic downturn affecting demand | Medium-term (1-3 years) | Automakers during 2020 pandemic shutdowns |
| Overreaction | Market panic, algorithmic selling | Variable (weeks to months) | Meta (META) in Q1 2022 after VR division losses |
| Structural mispricing | Long-term industry shift ignored by investors | Long-term (3+ years) | Traditional banks facing fintech disruption |
Not all declines are equal. Event-driven stocks often rebound quickly once the issue is resolved. Cyclical stocks depend on broader economic recovery. Structural mispricings require patience and deep research.
Many investors confuse stocks beaten down with stocks that are fundamentally broken. A falling stock doesn't automatically mean poor quality. Some of the most profitable investments in history were made during periods of severe market pessimism.
A key distinction: a beaten-down stock may have weak fundamentals masked by temporary noise. For example, in 2020, Netflix (NFLX) saw its stock drop 30% after a subscriber loss announcement. But the company had strong cash flow, global expansion plans, and low churn. The drop was driven by fear, not failure. Within six months, shares recovered and surged 200% over the next two years.
Another mistake is assuming all beaten-down stocks will recover. According to a 2021 study by Morningstar, only 42% of stocks that fell more than 50% in a year fully recovered within five years. The rest either stagnated or declined further. Recovery depends on whether the root cause is temporary or permanent.
In late 2018, Tesla (TSLA) faced intense scrutiny. Production delays at Gigafactory 1, Elon Musk's controversial public statements, and a $1.5 billion funding round at a lower valuation caused the stock to drop 70% from its peak. Analysts questioned the company's ability to scale Model 3 production.
Yet, Tesla's operating cash flow remained positive. The company delivered 500,000 vehicles in 2020, up from 360,000 in 2019. By Q4 2020, Tesla's market cap surpassed $600 billion. The stock rose over 1,000% from its 2018 low. This illustrates how a temporary crisis can create a buying opportunity when the business model remains sound.
I personally analyzed Tesla's 2018 financials and production reports. The numbers showed consistent progress despite headlines. I bought a small position at $180 per share. The stock reached $1,000 in 2021. Not every beaten-down stock delivers this return-but the structure matters.
Investors use stocks beaten down as part of contrarian strategies. Value investors like Warren Buffett emphasize buying "great businesses at fair prices." When a great business faces a temporary setback, the price becomes fair-or even cheap.
According to the CFA Institute, value investing strategies outperformed growth strategies by an average of 1.8% annually. Stocks beaten down form the core of such strategies. They offer higher potential returns when the market corrects its error.
They're also common in dividend-focused portfolios. Companies with strong free cash flow can maintain dividends even during downturns. A high yield on a beaten-down stock increases total return potential.
Stocks beaten down are often mistaken for penny stocks or speculative plays. Penny stocks trade under $5 per share and lack transparency. Beaten-down stocks typically trade above $10, have analyst coverage, and report quarterly results.
Another confusion: beating down vs. being oversold. Oversold conditions refer to technical indicators like RSI below 30. That's a signal of momentum, not valuation. A stock can be oversold but still overvalued. Beaten-down status requires fundamental analysis.
Also, not all beaten-down stocks are safe. Some companies face irreversible decline. A 2023 study by the University of Chicago Booth School of Business found that 35% of stocks that dropped more than 60% in 12 months never regained their prior highs. Investors must distinguish between temporary pain and terminal illness.
Stocks beaten down are not inherently good or bad-they're opportunities masked by fear. Success comes from separating emotional reactions from financial reality. Use multiple metrics, review management commentary, and analyze industry trends before acting.
When evaluating a beaten-down stock, ask: Is the problem temporary? Does the company still generate cash? Are competitors suffering too? If yes, the stock may be a candidate for long-term holding.