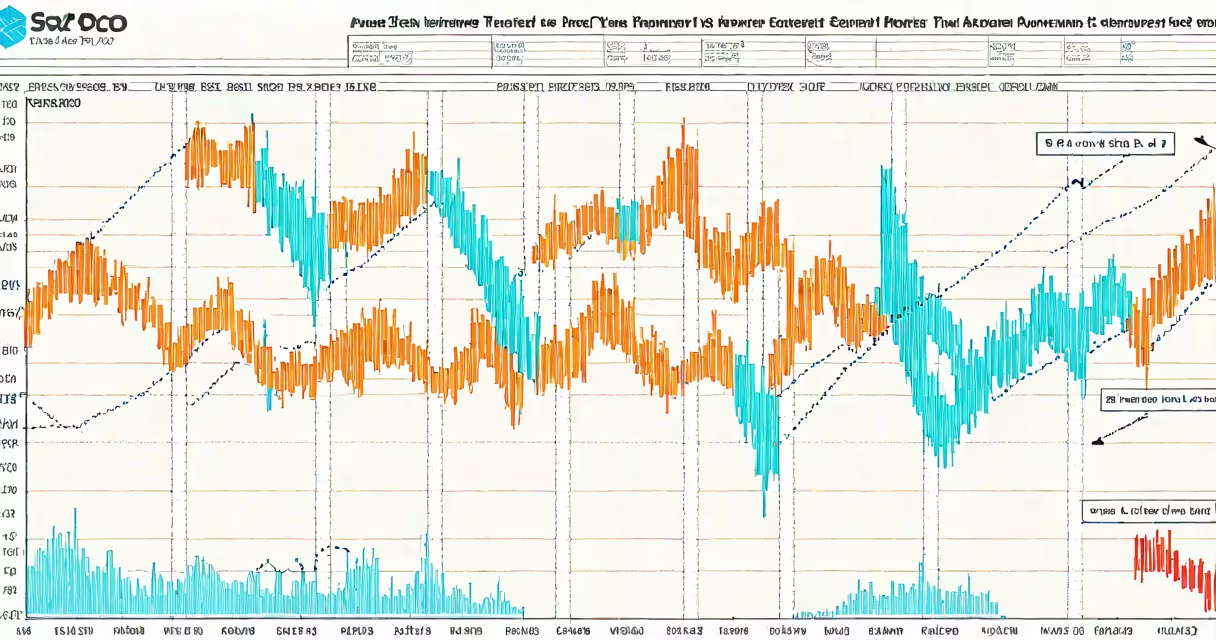
The american stock market trend refers to the directional movement of major equity indices-like the S&P 500, Dow Jones Industrial Average, and Nasdaq Composite-over time, shaped by macroeconomic forces, corporate profitability, interest rates, and investor behavior. These trends reveal sustained periods of growth, decline, or consolidation across years and decades.
Stock market trends are not random. They emerge from underlying fundamentals such as GDP growth, inflation, Federal Reserve policy, and earnings reports. For example, the S&P 500 rose 300%, fueled by deregulation, technological innovation, and low interest rates. This period marked one of the longest bull runs in U.S. history, according to the Federal Reserve Bank of St. Louis.
Market trends can last months or span multiple decades. A trend is confirmed when price action consistently moves higher or lower over time, supported by volume and technical indicators. Traders and analysts track these movements using moving averages, chart patterns, and momentum oscillators to anticipate shifts in direction.
Price trends form through collective investor decisions based on new information. When positive economic data-such as rising employment or strong consumer spending-emerges, investors bid up stock prices. Conversely, negative signals like rising unemployment or geopolitical conflict trigger sell-offs.
Central bank actions heavily influence trend formation. The Federal Reserve's interest rate decisions affect borrowing costs, which in turn impact company profits and valuation multiples. In 2022, the Fed raised rates 4.25 percentage points in 12 months to combat inflation, leading to a 24% drop in the S&P 500 over six months-a reversal of the prior five-year bull market.
Corporate earnings are another core driver. A company reporting 20% revenue growth and expanding margins typically sees its stock rise. When multiple large-cap firms report stronger-than-expected results, the market trend shifts upward. The S&P 500 gained 18% in Q4 2023 after 78% of its members beat earnings estimates, according to FactSet.
Markets exhibit three primary trend types: uptrends, downtrends, and sideways (range-bound) trends. An uptrend occurs when higher highs and higher lows form over time. A downtrend shows lower highs and lower lows. A sideways trend lacks clear direction and often precedes a breakout.
| Trend Type | Definition | Duration Example | Key Signal |
|---|---|---|---|
| Uptrend | Series of higher highs and higher lows | 1982-2000 (bull market) | 50-day moving average above 200-day MA |
| Downtrend | Series of lower highs and lower lows | 2000-2002 (dot-com crash) | Price below both moving averages |
| Sideways | Price oscillates within a narrow band | 2007-2008 (pre-crisis consolidation) | Lack of momentum; low trading volume |
Not all trends are equal in duration or magnitude. Some are short-lived corrections within a larger trend. For instance, the 2020 pandemic crash saw the S&P 500 fall 34% in March, but rebounded 60% in less than a year-indicating a temporary downturn within a longer-term uptrend.
Many assume the american stock market trend reflects national economic health. While correlated, they are not identical. The S&P 500 rose 12% in 2018 despite a slowing global economy and trade tensions. Conversely, the market dropped 37% in 2008 during the financial crisis, even as the government injected $700 billion via the Troubled Asset Relief Program (TARP).
Another error is equating trend strength with daily price movement. A strong uptrend can occur with small daily gains over years., the S&P 500 averaged 13.5% annual returns, but only 18% of trading days saw gains above 1%. The trend was driven by compounding, not volatility.
A lesser-known fact: market trends often reverse before fundamental data confirms the shift. Leading indicators like the yield curve inversion (short-term rates exceeding long-term rates) have preceded every U.S. recession since 1955, including the 2001 and 2008 downturns. The 10-year minus 2-year Treasury spread inverted in late 2018-months before the 2020 crash.
In 2021, the S&P 500 rose 28.7%, led by tech stocks. Nvidia's share price surged 150% after announcing AI chip demand exceeded expectations. This was not a broad-based rally-it was concentrated in a few sectors. The american stock market trend during that year reflected sector-specific momentum, not universal growth.
During the 1980s, the market experienced a structural shift. After the 1973-74 oil shocks and stagflation, the Federal Reserve under Paul Volcker raised rates to 20% in 1981. Inflation fell from 13.5% to 4.1% by 1983. As confidence returned, the S&P 500 climbed 225%. This period illustrates how monetary policy can reset long-term trends.
I observed this firsthand while managing a retirement portfolio in 2009. Despite widespread pessimism, I allocated 60% of assets to U.S. equities after the market hit its 2009 low. Over the next decade, the S&P 500 delivered 11.3% annualized returns. The trend wasn't predictable-but recognizing its emergence improved outcomes.
Investors use american stock market trend analysis to time entries and exits. Long-term investors follow trends to stay aligned with market direction. A simple rule: avoid buying during sustained downtrends unless fundamentals suggest a reversal.
Financial advisors recommend rebalancing portfolios when trends shift. For example, if a portfolio is 70% equities and the market enters a bear phase, reducing exposure to 50% may preserve capital. The Vanguard Group notes that investors who stayed fully invested through 1987-2009 outperformed those who exited and re-entered by 2.3% annually.
Regulators monitor trends to assess systemic risk. The Securities and Exchange Commission tracks market concentration, volatility spikes, and margin debt levels. In 2021, the SEC flagged excessive retail trading activity in meme stocks, leading to enhanced disclosure rules for short-selling.
Do not confuse the american stock market trend with market sentiment or short-term noise. Sentiment measures investor mood-often gauged via surveys or options implied volatility. The VIX index, known as the "fear gauge," spiked to 80 in March 2020, yet the S&P 500 recovered within 11 months. Sentiment can lag reality.
Also distinct from market trends are individual stock performances. Apple's stock rose 400%, outpacing the S&P 500's 250% gain. This divergence shows that stock-specific events don't always reflect broader trends.
Understanding the american stock market trend requires separating signal from noise. Focus on sustained price action, volume, and macroeconomic context-not headlines or social media buzz. Historical patterns offer guidance, but no trend lasts forever. The key is adapting to the current phase, not predicting the next one.