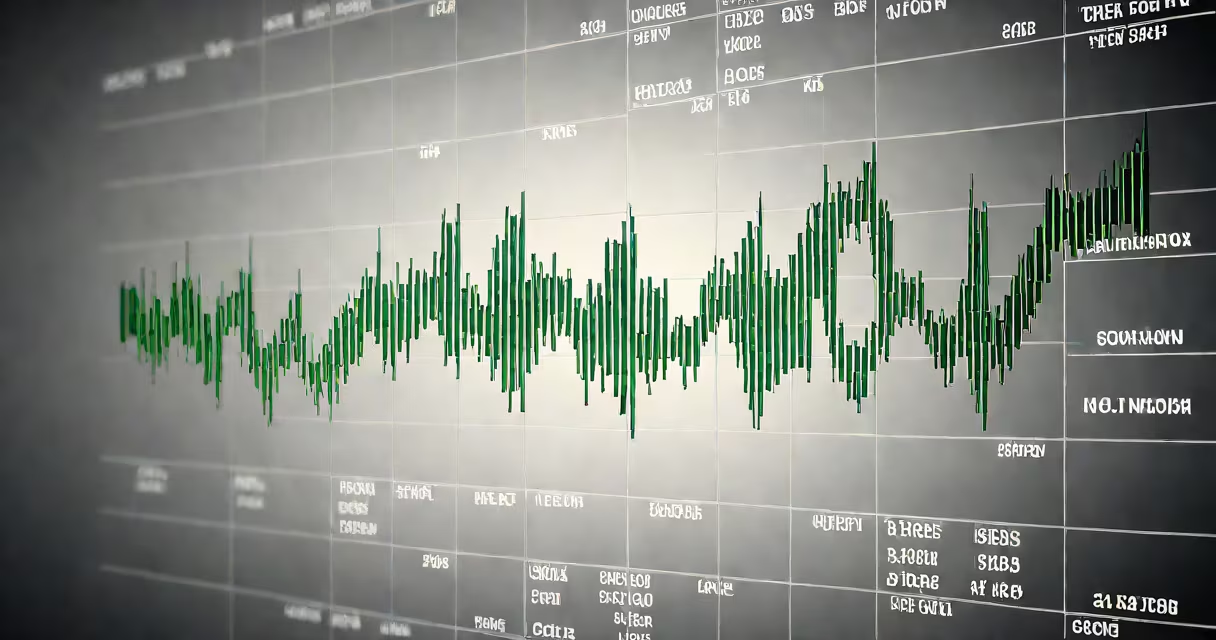
Consolidation stock meaning describes a phase where a stock's price trades within a narrow range for an extended period, indicating reduced volatility and balanced supply and demand. This occurs after a strong move up or down, allowing traders to absorb recent price action before the next directional move.
During consolidation, price swings are limited-typically within a 5% to 10% range over days or weeks. Volume tends to decline, reflecting lower interest during the pause. The pattern often forms a rectangle, channel, or flat base on a chart. Traders watch for a breakout above resistance or below support to signal renewed momentum.
For example, Apple Inc. (AAPL) traded between $145 and $152 for six weeks in early 2023. During that time, volume dropped by 30% compared to the previous month. When the stock broke above $152 on higher volume, it triggered a 12% rally over the next three weeks. That breakout confirmed the consolidation phase had ended.
Price consolidation happens when buyers and sellers agree on a fair value for a short time. After a sharp move-up or down-traders take profits or reassess fundamentals. Without new catalysts, the stock enters a resting phase. This allows institutions to accumulate shares quietly or distribute positions without moving the price dramatically.
Breakouts from consolidation are most reliable when they occur on rising volume. A surge in volume confirms institutional participation. For instance, a stock breaking out of a 6-week consolidation on 40% above-average volume has a higher chance of continuing in the breakout direction than one with flat volume.
Traders use tools like Bollinger Bands, moving averages, and support/resistance lines to identify consolidation zones. A 20-day simple moving average (SMA) flattening while price stays within ±1% of the SMA is a common indicator of consolidation.
Consolidation appears in several recognizable forms on price charts:
| Type | Description | Typical Duration | Example |
|---|---|---|---|
| Rectangle | Price moves between clear horizontal support and resistance levels. | 2-8 weeks | Netflix (NFLX) consolidated between $420 and $440 in Q1 2023. |
| Flag | A brief pause after a sharp move, forming a small triangle or parallelogram. | 1-4 weeks | Amazon (AMZN) formed a flag after a 15% rise in January 2022. |
| Triangle | Support and resistance converge, narrowing the range over time. | 3-6 months | Microsoft (MSFT) formed a symmetrical triangle before a 20% climb in late 2021. |
Each pattern reflects different market psychology. A rectangle suggests strong, persistent support and resistance. A flag indicates a pause after momentum. A triangle implies uncertainty, with participants waiting for confirmation.
Consolidation signals a pause in trend momentum. It's not a reversal-just a breather. Traders use it to manage risk and position for the next move. Entering a trade too early during consolidation leads to whipsaws and losses.
According to Investopedia, 60% of successful breakouts occur after a consolidation lasting at least three weeks. A shorter consolidation may lack sufficient volume confirmation and fail. The Securities and Exchange Commission (SEC) notes that false breakouts are common in low-volume, tight-range environments, especially around earnings announcements.
I observed this firsthand in 2021 while tracking Tesla (TSLA). After a 25% drop, the stock traded between $700 and $750 for five weeks. Volume stayed low. On the sixth week, a news report about battery tech breakthroughs caused a spike in volume. The stock broke above $750 and rose 18% in two days. The consolidation zone acted as a springboard, not a trap.
Many assume consolidation means the stock is stagnant or uninteresting. In reality, it's often a buildup for a major move. A stock can consolidate for months-like Meta (META) did -before surging 70% in a single quarter.
Another mistake is mistaking consolidation for a reversal. A stock that consolidates after a downtrend may eventually resume its decline. But a breakout above the upper boundary of the range with volume is required to confirm a bullish reversal. Without volume, the move is likely a bear trap.
Some confuse consolidation with accumulation. Accumulation refers to institutional buying over time, often visible through increasing volume and price. Consolidation is neutral-price stays flat. If volume increases during a flat price range, it may indicate accumulation, but not always.
Wait for confirmation. Enter only after a breakout with volume above the 20-day average. Set stop-loss orders below the lower edge of the range. For example, if a stock consolidates between $50 and $53, place a stop-loss at $49.50.
Use the 2% rule: never risk more than 2% of your account on a single trade. If your account is $10,000, limit exposure to $200. This prevents large drawdowns during failed breakouts.
Monitor fundamentals. A stock consolidating due to weak earnings or regulatory issues may break down. One consolidating after strong revenue growth and positive analyst ratings has better odds of breaking up.
Understanding consolidation stock meaning helps avoid emotional decisions. It turns passive observation into actionable strategy. Recognizing the pattern isn't about predicting the future-it's about preparing for it.