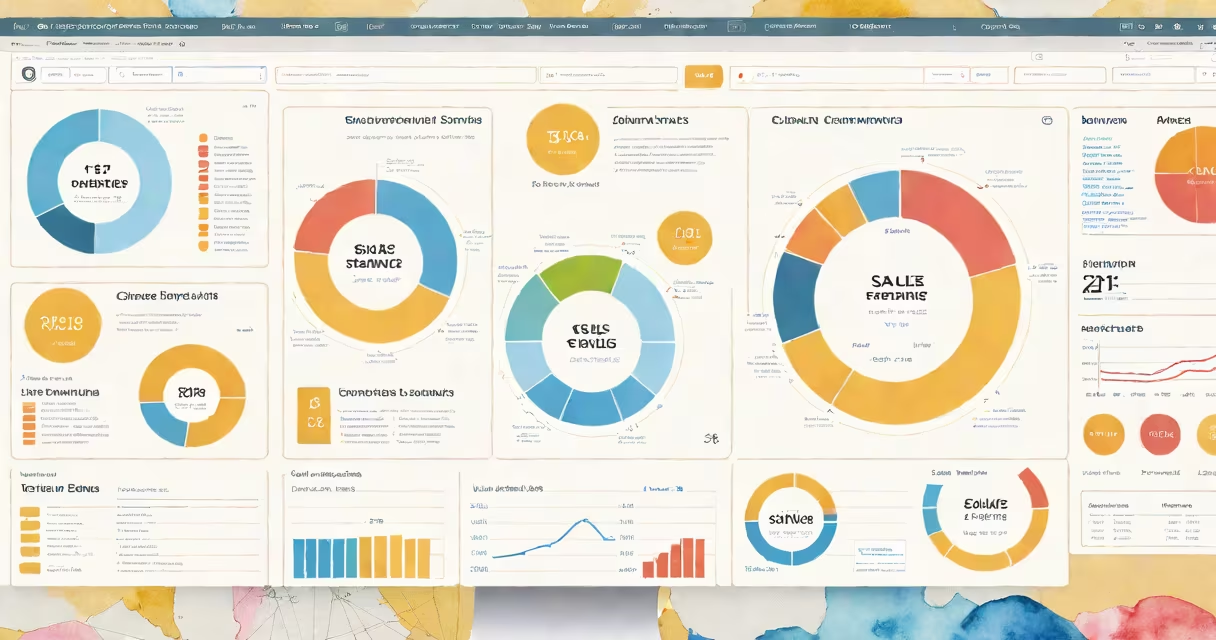
ecommerce reporting tools are software platforms that collect, analyze, and display key performance metrics from online stores to support data-driven decision-making. They change transaction logs, traffic patterns, and customer behavior into visual reports and dashboards, enabling merchants to track sales, monitor conversions, and improve marketing and inventory strategies.
These tools pull data from multiple sources-such as Shopify, WooCommerce, Google Analytics, and payment gateways-and consolidate it into unified views. Instead of manually compiling spreadsheets, users access real-time updates on revenue, customer acquisition cost, cart abandonment rates, and product performance. This enables faster responses to trends, such as sudden drops in traffic or spikes in returns.
For example, a store selling outdoor gear might use an ecommerce reporting tool to compare monthly sales of hiking boots across regions. The tool shows a 22% drop in the Northeast during October, which correlates with delayed shipments due to weather-related carrier delays. Without this insight, the team might have assumed declining demand. With it, they adjust shipping partners and run targeted promotions to recover lost sales.
At their core, ecommerce reporting tools automate data aggregation and visualization. They connect to APIs from shopping platforms, payment processors, and advertising accounts. Once linked, they sync new data every few minutes or hourly, depending on configuration.
After ingestion, the system applies logic to calculate KPIs-like average order value (AOV), customer lifetime value (CLV), and return on ad spend (ROAS)-and then renders them in charts, tables, or interactive dashboards. Users can filter results by date range, region, product category, or traffic source.
Advanced tools include anomaly detection. For instance, if daily revenue suddenly exceeds the 90th percentile of historical values, the system flags it for review. A spike in orders from a single country might indicate a viral social media campaign or a bot attack. Automated alerts notify teams via email or Slack, allowing rapid response.
Reporting tools vary by complexity, integration depth, and intended audience. Here's a breakdown of common categories:
| Type | Best For | Key Features | Examples |
|---|---|---|---|
| Basic | Small stores with limited staff | Pre-built templates, simple charts, export to CSV | Shopify Reports, Google Data Studio |
| Mid-tier | Growing brands needing deeper analysis | Custom dashboards, segmentation, API access | Looker Studio, Power BI (with ecommerce connectors) |
| Enterprise | Larger retailers with complex operations | Machine learning insights, role-based access, real-time alerts | Tableau, Sisense, Datorama |
Many tools offer both free and paid tiers. Free versions often limit data refresh frequency or the number of integrations. Paid plans enable advanced features like predictive forecasting, automated report scheduling, and multi-user collaboration.
One widespread misunderstanding is that reporting tools replace business judgment. They don't. They surface signals-but humans interpret context. A 40% increase in returns for a specific product may look alarming. But if the tool also shows that the product was newly promoted through a high-traffic influencer campaign, the rise in returns could reflect higher trial volume rather than quality issues.
Another error is assuming all tools deliver equal accuracy. Data quality depends on upstream integrity. If a store's product IDs are inconsistently labeled across platforms, even the most useful reporting tool will misattribute sales. According to Forrester Research (2023), 64% of ecommerce teams reported inaccurate reporting due to inconsistent data tagging.
Merchants use ecommerce reporting tools to answer three core questions: What's working? What's broken? Where should we invest?
For instance, a fashion brand noticed a 15% decline in conversion rate over two weeks. Using a reporting tool, they filtered data by device type and discovered mobile users had a 38% higher bounce rate. Further drill-down revealed slow load times on product detail pages. After optimizing images and compressing code, conversion improved by 21% within five days.
Marketing teams rely on these tools to evaluate campaign ROI. A campaign promoting winter coats generated $12,000 in sales but cost $3,500 in ad spend. The tool calculates ROAS at 3.4x-well above the 2.0x benchmark. This confirms the campaign's effectiveness and guides budget allocation for future seasons.
I once built a custom dashboard for a client selling handmade candles. The initial version showed total sales per month. After adding filters for customer location and referral source, we spotted that 68% of repeat buyers came from Instagram. We recommended shifting 40% of the ad budget Stories-resulting in a 27% increase in repeat purchases over six months.
They are not CRM systems, despite overlapping functions. While both track customer behavior, CRM tools focus on managing relationships-sending emails, tracking support tickets, segmenting audiences. Reporting tools focus on measuring outcomes-sales volume, profit margins, campaign performance.
Also, they are not replacements for business intelligence (BI) platforms. BI tools handle large-scale data modeling, complex queries, and data warehousing. Reporting tools sit on top of BI infrastructure, delivering simplified views for non-technical users. Think of BI as the engine, reporting tools as the dashboard.
Finally, reporting tools do not fix poor data hygiene. Garbage in, garbage out. If a store consistently mislabels products or fails to tag UTM parameters on links, reports will reflect those errors. Clean data pipelines are essential. As Gartner (2022) notes, "Inaccurate data leads to flawed strategy, wasted budgets, and eroded trust."
When used correctly, ecommerce reporting tools turn scattered data points into strategic clarity. They enable owners to move beyond gut instinct and make decisions backed by evidence-whether adjusting pricing, refining product offerings, or reallocating marketing spend. The goal isn't just visibility-it's actionability.
Understanding how your store performs requires more than a glance at daily sales. It demands consistent monitoring, pattern recognition, and timely intervention. That's what ecommerce reporting tools deliver: clarity, speed, and confidence in every decision.