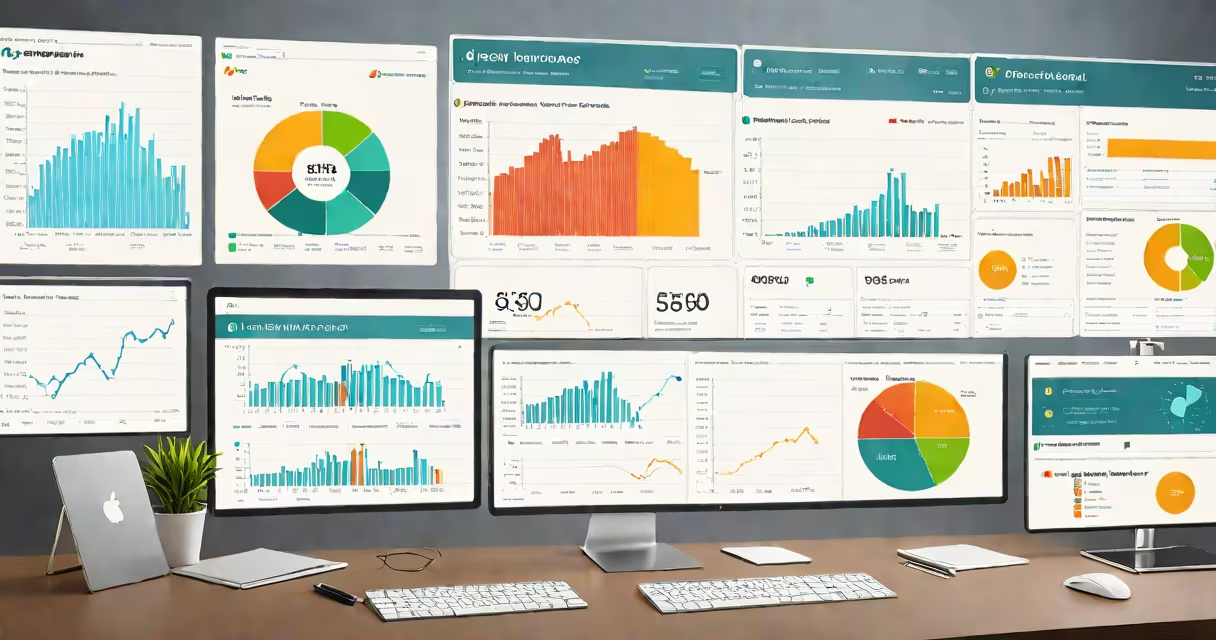
HR analytics dashboards are interactive data displays that visualize workforce metrics such as turnover, diversity, performance, and engagement to support strategic talent decisions. They pull live or scheduled data from HRIS, payroll, and survey systems to show trends and anomalies at a glance.
These dashboards are not static reports. They update automatically as new data enters the system. A manager can view department-specific attrition rates, compare them against company averages, and drill down into individual teams or roles to identify risk patterns. The goal is to move from reactive HR to proactive workforce planning.
For example, a dashboard might flag a 22% increase in voluntary departures in the software engineering team over three months. That insight prompts investigation-was there a recent pay adjustment? A leadership change? Without the dashboard, this trend might go unnoticed until it impacts project timelines.
They integrate data from multiple internal systems using APIs or scheduled exports. Common sources include HR information systems (HRIS), applicant tracking systems (ATS), performance review platforms, and employee feedback tools like SurveyMonkey or Qualtrics.
Data flows into a central repository-often a cloud-based data warehouse or a dedicated analytics platform. There, it's cleaned, normalized, and structured for analysis. For instance, "time to hire" is calculated as the average days between job posting and offer acceptance across departments.
Visual components then render the processed data. Bar charts show hiring volume by month. Heatmaps show regions with low retention. Trend lines track engagement scores over time. Users interact with filters-selecting by location, role, or tenure-to isolate specific segments.
Different business goals require different dashboard designs. Here are common configurations:
| Type | Focus Area | Key Metrics | Use Case Example |
|---|---|---|---|
| Recruitment | Hiring efficiency | Time-to-hire, cost-per-hire, source of hire | Compare which job boards yield the highest-quality candidates. |
| Retention | Employee stability | Turnover rate, tenure distribution, exit interview themes | Spot a spike in resignations among employees with 1-3 years' experience. |
| Performance | Productivity and potential | Performance rating distribution, promotion velocity, skill gap analysis | Identify high performers who haven't received a promotion in two years. |
| Diversity & Inclusion | Equity and representation | Gender ratio by level, ethnic diversity in leadership, pay equity ratios | Track progress toward a 40% female representation in technical roles by 2026. |
Some organizations build custom dashboards tailored to their unique workflows. A global tech firm might combine regional labor laws, visa processing times, and language proficiency scores into a single mobility dashboard for international assignments.
Many assume these tools predict individual employee behavior. They do not. They analyze group patterns, not personal outcomes. A dashboard may show that teams with low engagement scores have higher turnover-but it cannot tell you whether a specific employee will quit.
Another misconception is that dashboards replace HR professionals. They don't. They reduce manual reporting tasks and surface issues faster, but interpretation still requires human judgment. A spike in absenteeism might correlate with weather changes, poor office air quality, or burnout-only someone familiar with the team context can distinguish the cause.
A key distinction often missed: not all dashboards are equal. Some display raw numbers without context. A dashboard showing "35% of employees rated 'excellent' in Q2" lacks meaning unless paired with baseline data or peer comparisons. The most effective ones include benchmarks-industry standards or historical averages-to help users judge significance.
A national retail chain noticed rising turnover in store managers. Their HR analytics dashboard revealed that stores with managers who had less than six months of tenure were 3.2 times more likely to exceed budgeted labor costs. This was tied to inconsistent scheduling and training gaps.
Using the dashboard, HR leadership identified 12 underperforming locations. They launched a targeted onboarding program focused on shift planning and inventory management. After six months, turnover dropped by 18%, and labor cost variance improved by 27%.
This outcome wasn't due to a single metric-it came from combining attendance records, performance reviews, and schedule adherence data into a unified view. The dashboard didn't make the decision. It gave leaders the evidence to act.
One non-obvious truth: the most useful hr analytics dashboards aren't the fastest-they're the most accurate. Data errors propagate quickly. If the dashboard pulls incorrect start dates from the HRIS, a report on "tenure-based promotions" becomes misleading.
According to the Society for Human Resource Management (SHRM), 60% of HR teams report inconsistencies in workforce data across systems. These discrepancies lead to flawed conclusions. A study by Deloitte found that companies with clean, integrated HR data achieved 2.5x higher retention in high-turnover roles compared to those with fragmented data.
I've seen this firsthand. In a project supporting a healthcare provider's talent strategy, we discovered that the dashboard was counting part-time staff as full-time due to a misconfigured field mapping. Once corrected, the actual turnover rate was 14%-not the 28% previously reported. That error led to a misallocated $1.2 million in recruitment funding.
Start small. Pick one critical metric-like time-to-fill for open positions-and build a simple dashboard around it. Use free tools like Google Sheets with Power Query or Microsoft Power BI to prototype. Connect to your HRIS via API or CSV export.
Define success early. Is the goal to reduce hiring time by 20% in six months? To improve manager retention in sales teams? Measure progress against that objective.
Share access responsibly. Not everyone needs full visibility. Store sensitive data behind role-based permissions. A frontline supervisor may see team engagement scores but not individual responses to confidential surveys.
Finally, treat the dashboard as a living tool. Update it quarterly. Reassess what metrics matter. Remove outdated KPIs. Add new ones as business priorities shift.