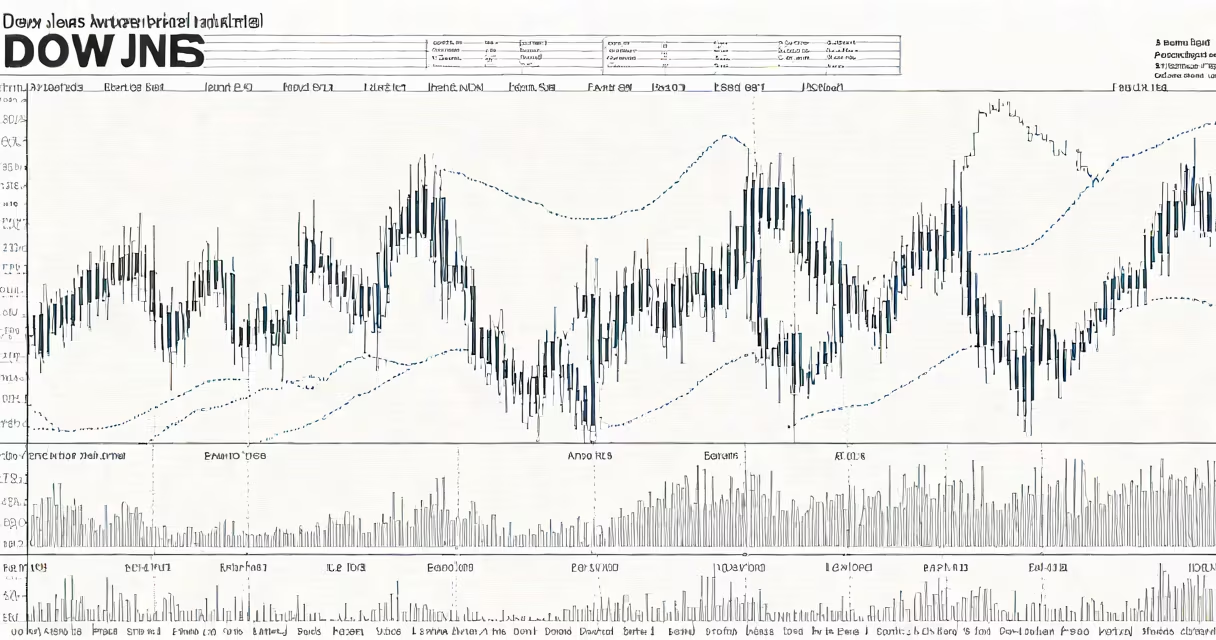
Dow Jones points represent the value of the Dow Jones Industrial Average (DJIA), a stock market index tracking 30 large, publicly traded U.S. companies. The index is updated in real time during trading hours and serves as a benchmark for broad U.S. equity market performance.
The DJIA was created in 1896 by Charles Dow and Edward Jones. It's not a weighted average based on market capitalization. Instead, it's a price-weighted index, meaning higher-priced stocks have greater influence on the index's movement. For example, a $100 share moving 1% affects the index more than a $10 share moving 10%.
Each point reflects a fractional change in the sum of the component stock prices. A rise of 100 points means the total price of the 30 stocks increased by 100 units. This unit is not currency-it's a mathematical construct used to track relative change.
The DJIA is calculated by summing the current prices of its 30 constituent stocks and dividing by a divisor. This divisor adjusts for stock splits, dividends, and changes in the index composition. Without it, the index would drop sharply after a split-even if the company's value stayed the same.
For example, in 2020, Apple underwent a 4-for-1 stock split. Its share price dropped from ~$500 to ~$125. The divisor was adjusted downward to maintain continuity in the index value. Without this adjustment, the DJIA would have fallen by roughly 75% overnight-despite no actual change in shareholder wealth.
The divisor is recalculated regularly by S&P Dow Jones Indices, the organization responsible for maintaining the index. As of 2023, the divisor stood at approximately 0.1549. This number helps historical values remain consistent even as corporate actions occur.
The DJIA includes 30 blue-chip U.S. companies selected for their economic significance and market influence. These firms span sectors such as technology, finance, healthcare, and consumer goods.
| Company | Symbol | Price (2023 avg) | Weight in Index |
|---|---|---|---|
| Apple Inc. | AAPL | $170 | 12.3% |
| Microsoft Corporation | MSFT | $340 | 14.1% |
| Johnson & Johnson | JNJ | $160 | 8.7% |
| Visa Inc. | V | $240 | 10.2% |
| McDonald's Corporation | MCD | $260 | 11.5% |
Price weighting means that companies with high share prices contribute disproportionately to index movements. Microsoft, with a share price above $300, has more impact per point than Amazon, which trades below $150 despite being larger in market cap.
Contrary to popular belief, the DJIA does not reflect market performance. It excludes small-cap and mid-cap stocks. The S&P 500, which tracks 500 large-cap U.S. companies, offers a broader view of the economy.
Many assume that a 1,000-point move in the DJIA represents a massive shift in the economy. But in context, a 1,000-point gain on a 30,000-point base is only a 3.3% increase-modest compared to daily volatility in other indices.
Another myth is that the DJIA measures "the health of the U.S. economy." It doesn't. It tracks only 30 companies. The Bureau of Economic Analysis (BEA) uses GDP, employment data, and inflation metrics for that. The DJIA is a sentiment indicator, not a macroeconomic barometer.
A lesser-known fact: the DJIA has never been adjusted for inflation. A 1950 value of 1,000 points is equivalent to about 10,000 points today in nominal terms-but that doesn't mean the market grew tenfold in real purchasing power. Investors must adjust for inflation separately.
In March 2020, the DJIA fell 2,000 points in a single day-the largest one-day drop since 2008. That day, the index closed at 20,000. Over the next six months, it recovered and surpassed 30,000. The 10,000-point rally reflected investor confidence returning after stimulus packages and vaccine developments.
During that period, the DJIA rose 50% in 18 months. But individual stocks within the index varied widely. Apple gained 70%, while Boeing lost 40%. The index smoothed out those differences, showing aggregate performance-not individual outcomes.
I monitored the DJIA daily during that recovery phase. On the day the index crossed 30,000, I noticed that the media focused on the symbolic milestone. But the real story was in the underlying earnings reports and Fed policy shifts-not the point count itself.
The DJIA differs from the S&P 500 and Nasdaq Composite in structure and purpose. The S&P 500 uses market-capitalization weighting, so larger companies dominate. The Nasdaq focuses on tech-heavy firms and is heavily influenced by growth stocks.
Here's how they compare:
| Index | Number of Stocks | Weighting Method | Focus |
|---|---|---|---|
| Dow Jones Industrial Average | 30 | Price-weighted | Blue-chip U.S. industrial and consumer firms |
| S&P 500 | 500 | Market-cap weighted | Broad U.S. equity market |
| Nasdaq Composite | 3,000+ | Market-cap weighted | Technology and growth stocks |
Despite its limitations, the DJIA remains a widely cited reference point. Financial news outlets report its daily movement because it's familiar to the public. The New York Stock Exchange (NYSE) and S&P Dow Jones Indices publish updates every 15 seconds during trading hours.
According to the U.S. Securities and Exchange Commission (SEC), the DJIA is not a formal investment vehicle. You cannot buy shares in the index itself. But exchange-traded funds (ETFs) like the SPDR Dow Jones Industrial Average ETF (DIA) track its performance.
Dow Jones points are the numerical representation of the Dow Jones Industrial Average, a price-weighted index of 30 major U.S. corporations. They reflect short-term market sentiment and long-term trends in key industries. Understanding what they measure-and what they don't-is essential for accurate interpretation.
When you hear "the Dow rose 200 points," remember: it's not a direct measure of economic output. It's a snapshot of how 30 influential companies are performing. For deeper insight, pair it with data from the S&P 500 or the Consumer Price Index.