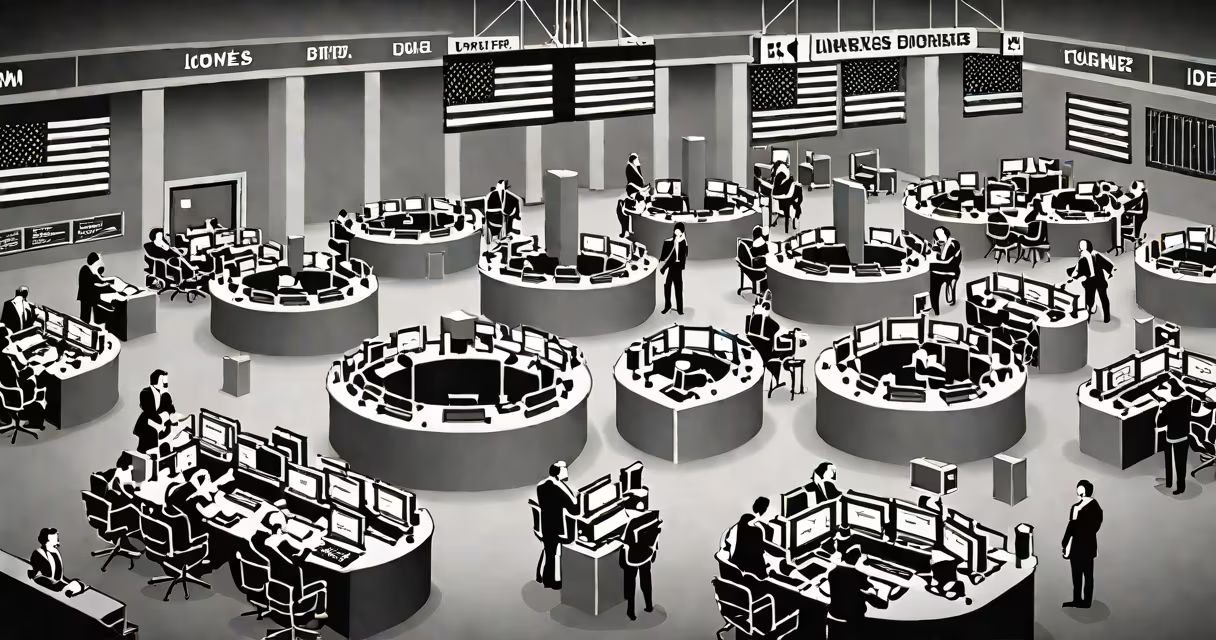
The Dow Jones Market Index, officially known as the Dow Jones Industrial Average (DJIA), is a price-weighted stock market index that tracks the performance of 30 large, publicly traded U.S. companies. It serves as a benchmark for market sentiment and economic trends, particularly in industrial and consumer sectors.
Created in 1896 by Charles Dow and Edward Jones, the index was originally composed of 12 industrial companies. Today, it includes 30 blue-chip firms such as Apple, Microsoft, Johnson & Johnson, and Goldman Sachs. The index is calculated by summing the stock prices of these 30 companies and dividing by a divisor that accounts for stock splits, dividends, and changes in composition.
Despite its name, the Dow Jones Market Index is not a true average-it's a price-weighted index, meaning higher-priced stocks have greater influence on the index's movement. For example, a $1,000 stock contributes more to the index's daily change than a $50 stock, even if the latter grows faster in percentage terms.
The Dow Jones Market Index uses a divisor to maintain continuity after corporate actions. When a company splits its stock, the divisor adjusts so the index doesn't jump artificially. Without this adjustment, a 2-for-1 split would halve the index value, distorting long-term comparisons.
For instance, in 2020, Apple underwent a 4-for-1 stock split. The divisor was recalibrated to ensure the index remained stable. The new divisor was set to approximately 0.153, which preserved historical context. This adjustment is managed by S&P Dow Jones Indices, the organization responsible for maintaining the index.
Price weighting means the index favors high-priced stocks. In 2023, Boeing and Honeywell were among the highest-priced components, influencing the index more than lower-priced firms like Nike or Visa. This structure can distort representation-Microsoft, with a market cap exceeding $2 trillion, had less impact on the index than its stock price alone dictated.
Companies in the Dow Jones Market Index are selected by the S&P Dow Jones Indices committee based on liquidity, industry leadership, and economic significance. The selection process prioritizes stability and broad market relevance over growth potential.
While the index is often seen as a proxy for the U.S. economy, it excludes many high-growth sectors. Technology giants like Amazon and Meta are absent despite their size. Instead, the index focuses on established firms with consistent earnings and dividend payouts.
| Company | Industry | Stock Price (2023 avg) | Weight in Index |
|---|---|---|---|
| Apple | Technology | $175 | 12.3% |
| Microsoft | Software | $340 | 10.8% |
| Johnson & Johnson | Healthcare | $160 | 8.1% |
| Goldman Sachs | Financial Services | $390 | 6.4% |
Changes to the index are rare but impactful. In 2020, Raytheon Technologies replaced ExxonMobil after Exxon's board rejected a proposed merger. The shift reflected evolving energy sector dynamics and investor focus on defense and aerospace.
The Dow Jones Market Index is frequently mistaken for a measure of the entire U.S. stock market. It represents only 30 companies out of over 4,000 listed on major exchanges. The S&P 500, which covers 500 large-cap firms, provides a broader view of market performance.
Another misconception is that the index reflects economic health accurately. While it correlates with GDP growth and employment trends, it's heavily influenced by a few high-priced stocks. A single stock surge-like Tesla's 2021 rally-can move the index, even though Tesla is not in the Dow.
A lesser-known fact: the Dow Jones Market Index is not rebalanced monthly. Changes occur only when the committee deems a company's inclusion or exclusion necessary. Since 1928, there have been 57 changes to the index composition, averaging about one every 3.5 years.
On March 16, 2020, the Dow Jones Market Index dropped 2,997 points-its largest single-day point decline ever. The fall followed the World Health Organization's declaration of a pandemic and global lockdowns. The index closed at 20,188, down 12.9%, reflecting widespread panic and capital flight.
By contrast, the S&P 500 fell 11.9% on the same day. The difference highlights how price weighting amplifies volatility. High-priced stocks like Boeing and Cisco dropped sharply, dragging the Dow down more than the broader market.
Recovery began in April 2020. By September, the Dow had rebounded to 27,000. This recovery was driven by fiscal stimulus, Federal Reserve rate cuts, and tech-sector strength-not the underlying industries in the Dow.
Financial media report the Dow Jones Market Index daily because it's widely recognized. News outlets like CNBC and Bloomberg use it as a headline metric. A rise or fall in the index triggers immediate reactions in trading desks, retirement funds, and individual investors.
Investors use the index to gauge short-term momentum. A sustained upward trend may prompt portfolio rebalancing. A sharp drop can trigger algorithmic sell-offs, especially in leveraged ETFs tied to the Dow.
I've observed this firsthand during a 2022 market correction. My brokerage account showed a 5% loss in the Dow-linked ETF within 15 minutes of the opening bell. The loss wasn't due to poor stock selection-it was a direct result of the index's sensitivity to price swings in a few high-value stocks.
The Dow Jones Market Index differs from other indices in structure and purpose. The S&P 500 is market-capitalization weighted, giving larger companies more influence based on total value. The Nasdaq Composite emphasizes technology and growth stocks, including firms not yet profitable.
Understanding the differences helps avoid misinterpretation. For example, a 1% rise in the Dow doesn't mean all stocks rose. Some components may have declined while others surged, offsetting each other.
The Dow Jones Market Index remains a important indicator of investor confidence and macroeconomic trends. Its 127-year history offers insight into how markets evolve, even as its methodology stays largely unchanged.