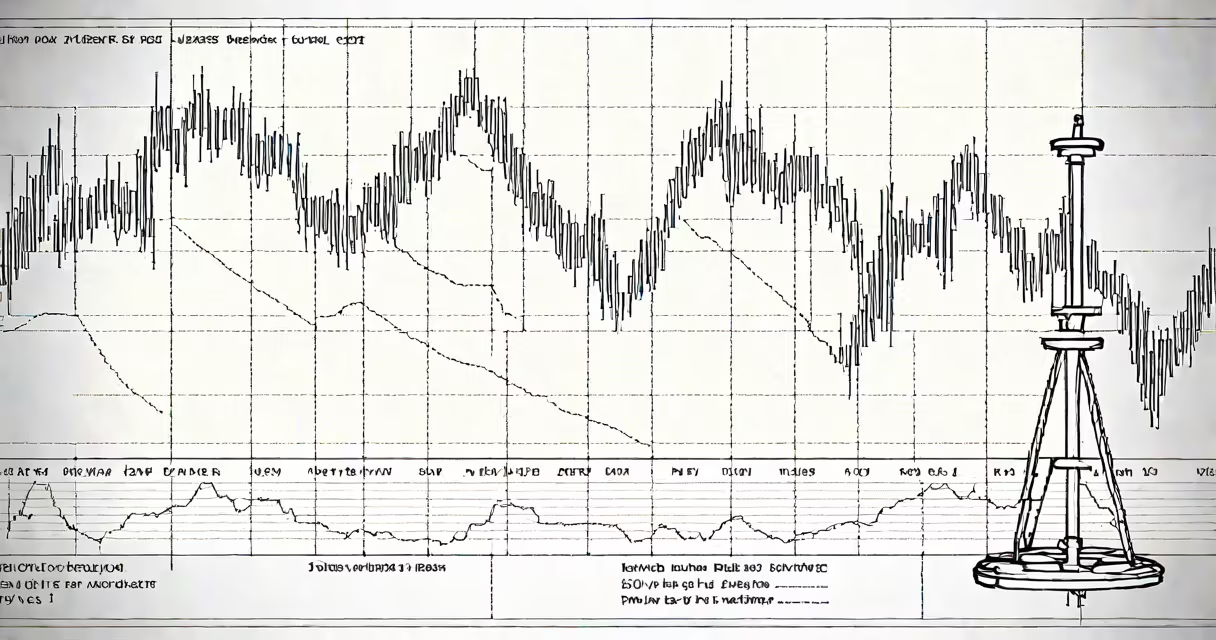
The dow jones index candlestick chart is a visual representation of the daily price movement of the Dow Jones Industrial Average (DJIA), using colored rectangular bars to display opening, closing, high, and low prices for each trading day.
Candlestick charts originated in 18th-century Japan for rice futures trading. They were reintroduced to Western markets in the late 20th century and are now standard in technical analysis. Each candlestick represents one day's trading activity. The thick part-the body-shows the opening and closing prices. A green or white body means the close was higher than the open; a red or black body means the close was lower.
The thin vertical lines above and below the body are called wicks or shadows. The top of the upper wick shows the highest price traded that day; the bottom of the lower wick shows the lowest. When the market closes above the open, the candle is typically colored green or white. When it closes below the open, it's red or black. This color coding allows traders to quickly assess sentiment.
Traders analyze patterns formed by multiple candles. For example, a "hammer" pattern-a long lower shadow and small body near the top-suggests a potential reversal after a downtrend. A "doji," where the open and close are nearly equal, indicates indecision. These patterns help predict short-term direction shifts.
For the Dow Jones Index, which tracks 30 large U.S. companies including Apple, Microsoft, and Johnson & Johnson, candlestick charts are used to spot momentum changes. A series of long green candles suggests bullish strength. A cluster of red candles with long upper wicks may indicate resistance at current levels.
| Element | Meaning | Example (DJIA) |
|---|---|---|
| Green body | Close > Open | DJIA closed 300 points higher than it opened on May 10, 2024 |
| Red body | Close < Open | DJIA dropped 150 points on March 14, 2024 |
| Long upper wick | Price rose above open but closed lower | High reached 40,500; close at 40,200; open at 40,100 |
| Doji | Open and close nearly equal | Open: 39,800; Close: 39,810; High: 40,000; Low: 39,750 |
One common mistake is assuming candlesticks predict future prices. They don't. They reflect past behavior. A bullish engulfing pattern-where a green candle completely covers a red one-may suggest upward momentum, but it doesn't guarantee a rise. Confirmation requires volume and follow-through.
Another misconception is that candlestick patterns work universally. They don't. A "morning star" pattern-three candles signaling a reversal-works better in trending markets. In choppy or sideways conditions, false signals increase. The Dow Jones Index, with its 30 large-cap stocks, tends to trend more than smaller indices, making candlestick analysis more effective here than on speculative sectors.
I once used a 15-minute candlestick chart during a live market session to spot a sudden drop in the DJIA. The pattern showed a series of red candles with long upper wicks, indicating selling pressure. I checked the S&P 500 and Nasdaq charts simultaneously. Only the Dow showed this structure. That divergence helped me avoid a losing trade.
The composition of the Dow Jones Index affects how candlesticks behave. Unlike the S&P 500, which weights stocks by market cap, the DJIA uses price weighting. So a $100 stock moves the index more than a $50 stock, even if the latter has larger market capitalization. This means a single high-priced stock-like Boeing or Goldman Sachs-can distort the appearance of a candlestick pattern.
For example, on January 12, 2024, Boeing's stock fell 6% due to a production delay. Its price weight caused the DJIA to drop 250 points despite gains in other components. The resulting candlestick had a long red body and a short lower wick. Without knowing the underlying cause, a trader might misinterpret this as broad market weakness.
According to Investopedia, candlestick patterns have a success rate of about 55% in predicting short-term direction when combined with volume and moving averages. The CBOE Volatility Index (VIX) data from 2023 shows that during periods of high volatility, candlestick accuracy drops to around 48%. This confirms that context matters.
When analyzing the dow jones index candlestick chart, focus on the relationship between price action and volume. A green candle with rising volume suggests strong demand. A red candle with high volume indicates panic selling. Ignoring volume leads to false signals.
Use tools like TradingView or Thinkorswim to overlay indicators such as the 50-day and 200-day moving averages. When a candle closes above both, it strengthens a bullish case. When it closes below, it reinforces bearish sentiment.
Finally, remember: no single tool predicts the market. The dow jones index candlestick chart is a lens, not a crystal ball. It shows what happened, not what will happen. Combine it with economic data, earnings reports, and central bank policy to build a complete picture.