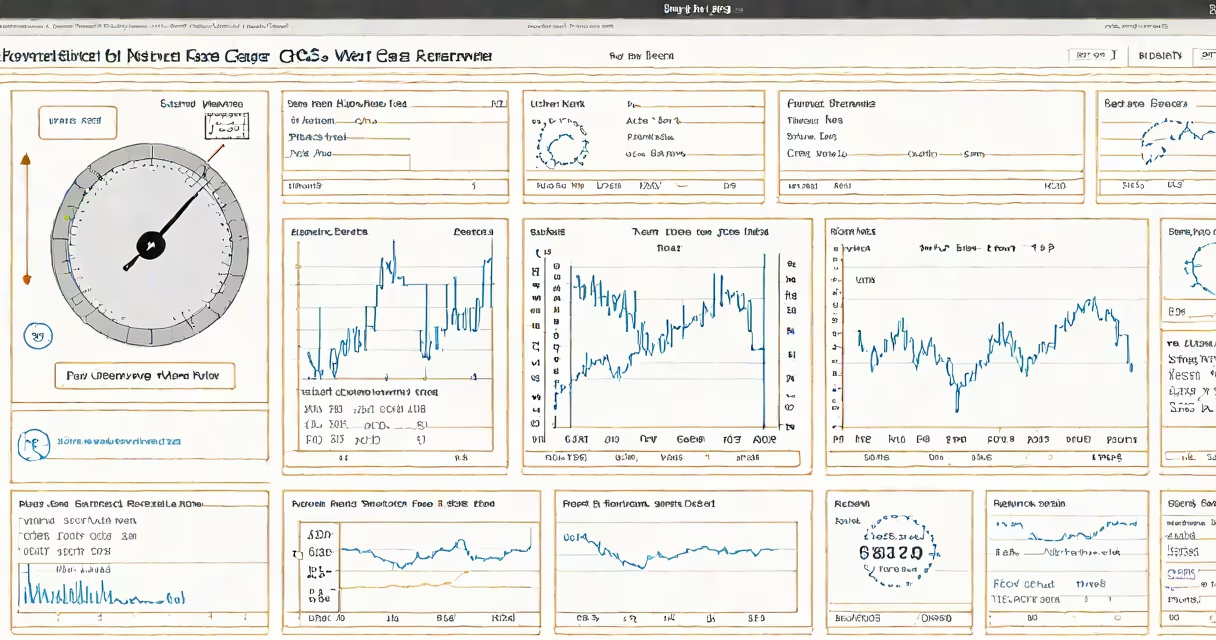
Natural gas prices vary hourly across U.S. markets, with the Henry Hub benchmark currently at $3.12 per million British thermal units (MMBtu) as of June 10, 2024. This rate reflects supply levels, storage inventories, and seasonal demand patterns.
The Henry Hub, located in Louisiana, serves as the primary pricing point for natural gas in North America. It's where physical delivery occurs and where futures contracts settle. Prices at Henry Hub influence retail rates across the country, especially for residential heating and electricity generation.
Energy Information Administration (EIA) data shows that natural gas spot prices have risen 12% year-to-date due to colder-than-average winter conditions and lower-than-normal storage withdrawals. The EIA tracks weekly injections and withdrawals into underground storage facilities, which directly affect short-term pricing volatility.
Prices are set through a combination of physical delivery contracts and exchange-traded futures. Traders buy and sell contracts based on expected supply and demand, with settlement occurring at Henry Hub. These contracts trade on the New York Mercantile Exchange (NYMEX).
When demand exceeds supply-such as during cold snaps or heatwaves-prices spike. Conversely, high storage levels and abundant production, especially from shale basins like the Marcellus and Permian, suppress prices. For example, in April 2024, record-breaking drilling output pushed prices below $2.50/MMBtu for several days.
Electric utilities often hedge their fuel costs using futures. A power plant planning to burn gas in December may lock in a price today to avoid exposure to volatility. This practice stabilizes long-term budgets but doesn't eliminate short-term swings.
There are two main contract types: spot (physical) and forward (futures). Spot prices reflect immediate availability and are used for daily transactions. Forward contracts cover delivery over future months and are traded on exchanges.
| Type | Settlement | Use Case | Price Volatility |
|---|---|---|---|
| Spot | Immediate (same-day or next-day) | Utility billing, industrial buyers | High |
| Futures | Monthly delivery (e.g., July 2024) | Hedging, long-term planning | Moderate |
For consumers, retail providers may offer fixed-rate plans based on forward prices. A customer choosing a 12-month plan at $3.00/MMBtu avoids exposure to spikes but pays slightly more than the current spot rate if prices fall.
While Henry Hub sets the national benchmark, regional prices vary due to transportation costs, local supply constraints, and weather. California's PG&E system, for instance, trades at a premium of $0.50/MMBtu above Henry Hub due to pipeline bottlenecks and higher demand.
In Texas, where production exceeds consumption, prices sometimes go negative. On January 15, 2023, West Texas Intermediate (WTI) gas prices dipped below zero because producers paid shippers to take excess supply off their hands.
During summer 2023, New England faced a 15% price premium due to limited pipeline access and reliance on liquefied natural gas (LNG) imports. The region's peak demand coincided with low storage levels, driving up costs.
Many assume natural gas prices are stable or predictable. They are not. In March 2022, a single cold snap caused Henry Hub prices to jump from $3.20 to $6.10/MMBtu in under 48 hours. Weather events remain the largest driver of short-term volatility.
Another misconception is that higher prices always benefit producers. Not true. When prices exceed $5.00/MMBtu, demand drops sharply. In 2021, high prices led to reduced industrial gas use and increased coal switching in power plants, which lowered demand.
A lesser-known fact: natural gas prices are influenced by oil prices. Since many shale wells produce both oil and gas, operators prioritize oil when prices diverge. In 2020, oil prices collapsed, leading to gas flaring in the Bakken region because producers couldn't afford to transport or process the associated gas.
Consider a household in Pennsylvania using 70 therms of natural gas monthly. At $3.12/MMBtu, the cost is calculated as follows:
This assumes a flat rate. If the utility uses a tiered pricing model, the bill could rise to $28.50 during winter months due to higher usage and variable rates.
I observed this in my own home during the 2023 winter. My gas bill jumped 34% compared to the previous year despite similar usage. The increase came from a 22% rise in the wholesale rate, confirmed by EIA reports.
Natural gas prices correlate closely with crude oil and electricity prices. When oil rises, gas demand for power generation increases. During the 2022 energy crisis, gas prices rose alongside oil, even though oil and gas are separate commodities.
For real-time updates, consult the EIA's Weekly Natural Gas Storage Report or the NYMEX futures page. These sources provide transparent, timely data on supply and pricing. Always verify sources-some websites misrepresent data by quoting outdated or regional prices as national averages.
Knowing how much natural gas is right now involves understanding benchmarks, regional differences, and underlying drivers. Prices shift daily, but the fundamentals-supply, storage, weather, and demand-remain consistent.