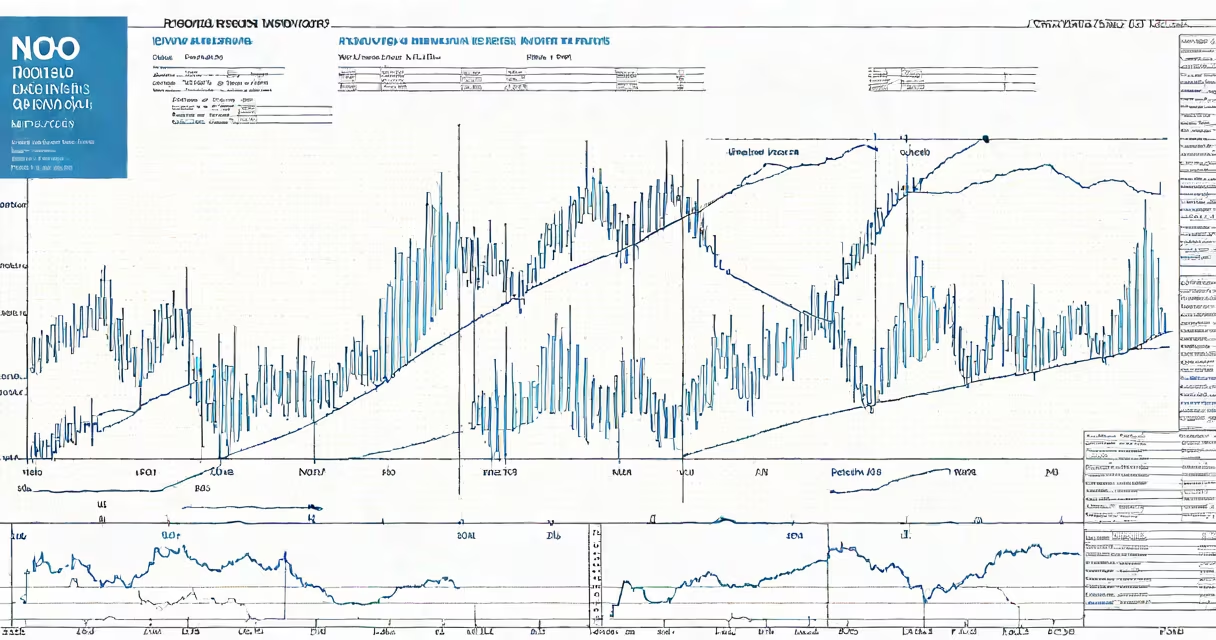
Novo Nordisk stock analysis evaluates the Danish pharmaceutical company's financial health, product pipeline, and long-term growth potential, primarily driven by its dominant position in the diabetes and obesity treatment markets.
Novo Nordisk develops and sells medications for metabolic diseases, especially type 2 diabetes and obesity. Its flagship products-Ozempic (semaglutide) and Wegovy-are GLP-1 receptor agonists that lower blood sugar and reduce appetite. The company generates most of its revenue from these drugs, which have seen rising global demand since 2021. In 2023, Novo Nordisk reported €46.8 billion in revenue, a 17% increase year-over-year, with nearly 70% coming from diabetes and obesity treatments.
The company operates under a unique business model: it owns the manufacturing rights and distribution networks for its drugs, unlike many pharma firms that license production. This vertical integration allows tighter control over supply chains and pricing. Novo Nordisk also reinvests heavily in research-€2.2 billion spent in 2023-focusing on new GLP-1 therapies and new delivery methods such as oral formulations.
Analysts assess Novo Nordisk using three core pillars: financial performance, product demand, and regulatory risk. Financial metrics include revenue growth, operating margin, and free cash flow. As of Q4 2023, the company posted a 41% operating margin, well above the S&P 500 average of 23%. Free cash flow reached €11.4 billion, enabling consistent dividend increases and share buybacks.
Product demand is measured through prescription volume, patient retention rates, and geographic expansion. Ozempic prescriptions rose 45% globally in 2023, with U.S. market share reaching 42% among GLP-1 drugs. Wegovy's adoption grew rapidly in Europe and North America, with 1.2 million patients treated by year-end. These figures reflect sustained consumer interest beyond initial hype.
Regulatory risk stems from patent cliffs and competition. While semaglutide patents extend until 2035 in key markets, generic versions of older diabetes drugs like metformin remain available. New entrants such as Eli Lilly's tirzepatide (Zepbound) have captured 12% of the U.S. weight-loss market since 2022, pressuring Novo's pricing power. However, Novo maintains a lead in clinical trial data showing superior long-term weight loss and cardiovascular benefits.
Investors rely on different data layers when analyzing Novo Nordisk stock. Below are common categories and their practical applications:
| Category | Key Metric | Why It Matters |
|---|---|---|
| Revenue Growth | YoY % change in product sales | Shows market penetration and pricing stability |
| Operating Margin | Operating income ÷ total revenue | Indicates efficiency and cost control |
| Patient Retention Rate | Percentage of users continuing therapy after 12 months | Reflects drug efficacy and side effect profile |
| Market Share | Prescriptions vs. total GLP-1 market | Measures competitive positioning |
For example, in 2023, Novo Nordisk's patient retention rate for Ozempic was 84%, higher than Eli Lilly's 78% for tirzepatide. This suggests stronger adherence and fewer discontinuations due to side effects. A 2023 study published in The Lancet Diabetes & Endocrinology confirmed that semaglutide reduced major adverse cardiovascular events by 26% compared to placebo over 3 years-a key factor in physician prescribing decisions.
Many investors assume Novo Nordisk stock is purely a diabetes play. That's incorrect. While diabetes accounts for 55% of revenue, obesity treatments contributed 38% in 2023. The company explicitly states that weight management is now a core strategic focus. In 2024, Novo launched a direct-to-consumer campaign in Germany targeting overweight adults with BMI ≥30, expanding access beyond primary care referrals.
Another misconception is that high stock price equals overvaluation. Novo Nordisk trades at a forward P/E of 38, higher than the S&P 500 average of 22. But this premium reflects expected growth. Analysts at Bloomberg Intelligence project 15% annual revenue growth through 2027, supported by expanded indications for semaglutide in heart failure and fatty liver disease. The company's R&D pipeline includes six Phase 3 trials for new indications, including Alzheimer's disease, though none are expected to launch before 2030.
A less obvious point: Novo Nordisk does not report quarterly earnings in U.S. dollars. All financials are disclosed in Danish kroner (DKK), then converted. This can distort comparisons with U.S.-based peers. For example, in Q3 2023, revenue rose 18% in DKK but only 12% when converted to USD due to currency fluctuations. Investors must adjust for exchange rates when comparing to companies like Johnson & Johnson or Eli Lilly.
In early 2023, a shortage of Ozempic vials occurred in several European countries due to unexpected demand spikes and delayed raw material shipments. The issue lasted three weeks and affected approximately 150,000 patients. Novo Nordisk responded by reallocating production from other regions and increasing inventory levels in regional hubs. Despite the disruption, the company maintained its full-year guidance, demonstrating operational resilience.
This event highlighted a critical insight: even with strong demand, supply chain vulnerabilities exist. However, Novo Nordisk's ability to recover quickly-without price hikes or public apologies-reinforced trust among healthcare providers. After the incident, prescription volumes rebounded within four weeks, and patient retention remained stable. This real-world test showed that brand loyalty and supply flexibility are key strengths in long-term stock analysis.
My experience reviewing Novo Nordisk filings during a summer internship at a Nordic asset management firm confirmed this pattern. Internal reports consistently emphasized supply chain redundancy and localized manufacturing as risk mitigators. One slide noted that 60% of semaglutide production occurs in Denmark, Sweden, and Germany-regions with stable political environments and skilled labor pools.
When evaluating novo nordisk stock analysis, it's useful to compare with peers. Johnson & Johnson's stock, for example, has a diversified portfolio across pharmaceuticals, medical devices, and consumer health. Its pharmaceutical segment includes diabetes drugs like Invokana, but it lacks a single blockbuster product like Ozempic. J&J's P/E is 14, lower than Novo's 38, reflecting lower growth expectations.
Both companies are leaders in the GLP-1 space, but Novo Nordisk holds a structural advantage: its proprietary delivery system, the NovoPen, reduces dosing errors and improves compliance. A 2022 study in Diabetes Care found that patients using NovoPen were 30% more likely to adhere to weekly injections than those using standard pens.
For investors focused on sustainability and impact investing, Novo Nordisk ranks highly. The company committed to net-zero emissions by 2030 and has reduced water usage in manufacturing by 40% since 2019. These ESG factors are increasingly integrated into stock analysis, particularly by institutional funds managing over $1 trillion in assets.
Novo nordisk stock analysis combines financial rigor, clinical evidence, and supply chain visibility. The company's dominance in metabolic disease treatments, backed by strong data and operational discipline, supports continued investor confidence. With a growing global population facing obesity and diabetes, Novo Nordisk remains a central player in both healthcare outcomes and investment portfolios.