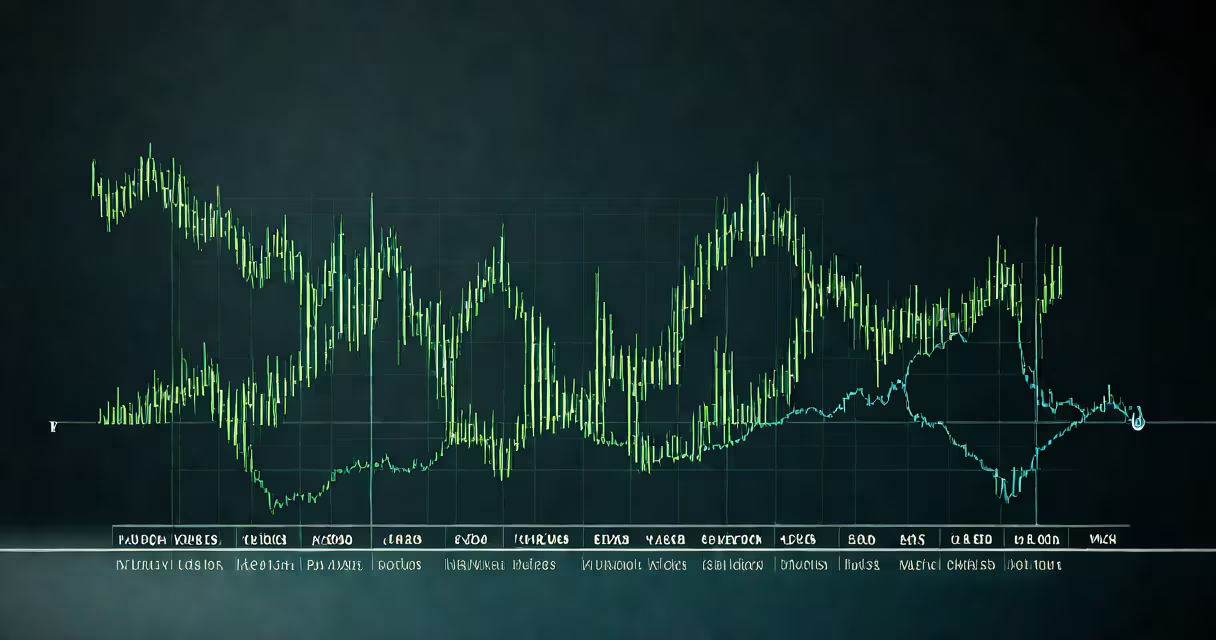
Stock volume refers to the number of shares traded during a specific time frame, such as a day, hour, or minute. It reflects how actively a stock is being bought and sold. High volume indicates strong market interest, while low volume suggests limited participation.
Volume is a core metric in technical analysis. It confirms price movements-rising prices with high volume suggest strong buying pressure. Falling prices with high volume may signal aggressive selling. Without volume context, price changes can mislead.
For example, if Apple (AAPL) sees 10 million shares trade in a single day, that's volume. If the same stock trades only 100,000 shares, volume is low. The difference reveals whether price moves are driven by broad market action or isolated trades.
Each trade-buy or sell-contributes to volume. A single transaction of 1,000 shares adds 1,000 to the daily volume total. Volume accumulates across exchanges, brokers, and electronic platforms. Data providers like Bloomberg and Yahoo Finance compile this into real-time and historical charts.
Volume is often displayed as a histogram below a price chart. The bars rise when trading increases. Traders watch for spikes-sudden jumps in volume-that can precede price breakouts or reversals. A spike on a downward move may warn of panic selling.
Volume doesn't measure price change-it measures activity. A stock can rise $1 with 100,000 shares traded, or fall $0.50 with 1 million shares traded. The latter shows stronger conviction behind the move, even if the price change appears smaller.
Traders analyze volume across different timeframes:
| Timeframe | Use Case | Example |
|---|---|---|
| Daily volume | Identify trend strength | A stock rises 3% on 20 million shares traded-high volume confirms bullish momentum. |
| 5-minute volume | Spot intraday breakouts | A sudden surge in volume at 10:15 AM may signal news-driven demand. |
| Volume-weighted average price (VWAP) | Measure fair value based on volume | Traders use VWAP to assess whether current prices are above or below average volume levels. |
Volume is also analyzed relative to average volume. A stock trading at 150% of its 30-day average volume suggests unusual activity. This can signal earnings announcements, mergers, or analyst upgrades.
Many assume volume equals price movement. That's false. A stock can have high volume and flat prices if buyers and sellers are evenly matched. Conversely, low volume can accompany sharp price swings-especially in thinly traded stocks.
Another error: equating volume with volatility. High volume doesn't mean higher price swings. Volatility measures price change size; volume measures trading frequency. A stock can move 2% with low volume, or 0.1% with high volume.
Here's a non-obvious point: volume can be manipulated. In low-liquidity stocks, large trades can artificially inflate volume. This is called "wash trading" and is illegal in regulated markets. The SEC monitors such patterns to detect market manipulation.
In April 2023, Tesla (TSLA) reported better-than-expected earnings. On the announcement day, the stock rose 8%. Daily volume hit 120 million shares-over 300% above its 30-day average. This spike confirmed broad investor interest, not just a few large trades.
Without volume data, the 8% gain might have seemed speculative. But the high volume validated the move. Institutional investors were buying, and retail traders followed. Volume acted as a filter-confirming the price action was meaningful.
I've seen this pattern in my own trading. In 2021, a small-cap biotech stock jumped 40% in a week. Price charts looked explosive. But volume stayed flat. I waited. The stock reversed 25% within two days. Volume had failed to confirm the rally.
Stock volume is not the same as market capitalization. Market cap measures total company value-shares outstanding times price. Volume measures how many shares changed hands. A $1 trillion company can have low volume if few people trade it.
Volume also differs from turnover. Turnover is the percentage of shares traded relative to float. For example, a stock with 1 billion shares outstanding and 50 million traded in a day has 5% turnover. Volume is the raw number-50 million shares.
Some confuse volume with order book depth. Depth shows pending buy and sell orders. Volume counts executed trades. A stock can have deep bids and asks but no volume if no trades occur.
Volume helps traders avoid false breakouts. A breakout above resistance with low volume is weak. A breakout with high volume is more likely to hold. This principle applies to both short-term scalping and long-term investing.
According to Investopedia, volume is one of the five key technical indicators used by professional traders. The other four are price, moving averages, RSI, and MACD. Volume provides context-without it, other indicators can misfire.
The CBOE also tracks volume patterns. Their research shows that stocks breaking out on volume above the 50-day average see a 62% success rate in sustaining upward momentum over the next 10 days. That's a concrete edge for strategy development.
Understanding what does stock volume mean gives you a direct window into market psychology. It shows who's driving price-retail traders, institutions, or algorithmic systems. When volume aligns with price direction, confidence grows. When it diverges, caution is warranted.
When evaluating asset health, volume remains a foundational signal. It's not a standalone predictor, but it's essential for interpreting price behavior accurately.