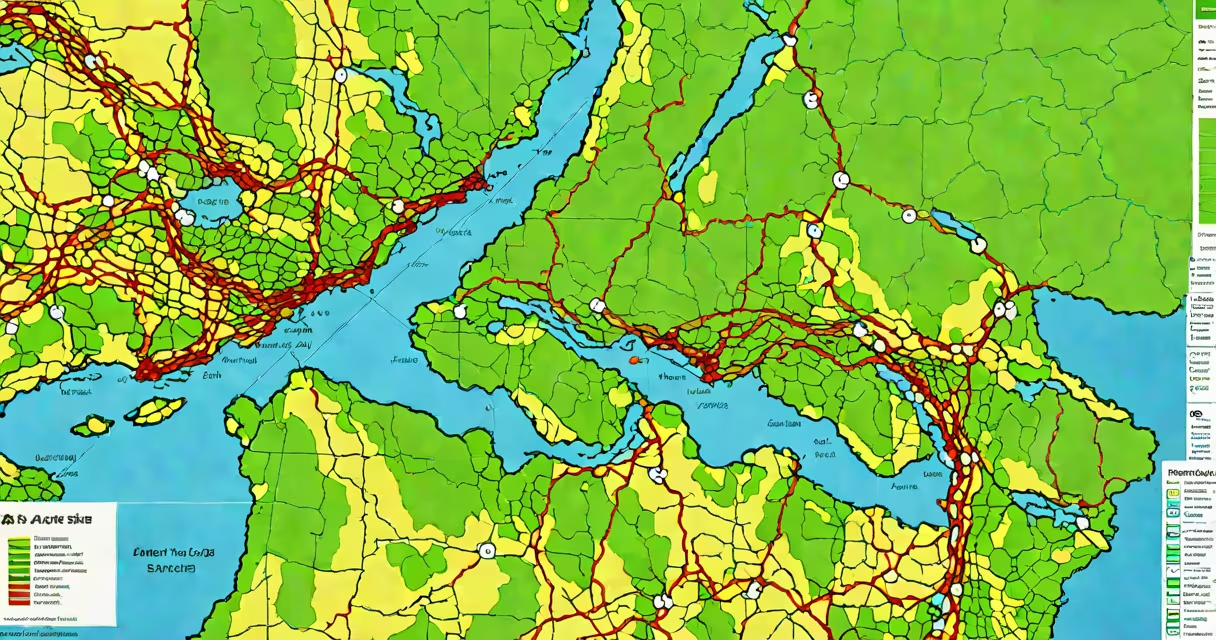
An arc gis map is a digital representation of geographic data that overlays spatial information-such as roads, land use, elevation, and population density-onto a coordinate system. It combines data layers to show patterns, relationships, and trends across physical locations. These maps are created and managed using Esri's ArcGIS platform, which supports both desktop and cloud-based workflows.
Each arc gis map uses a coordinate reference system (CRS) to align features precisely. For example, a map of New York City might use WGS84 (latitude/longitude) or NAD83 (North American Datum) to ensure that a subway station plotted at 40.7589° N, 73.9851° W appears correctly relative to streets and buildings. Data layers can include vector features (points, lines, polygons), raster images (satellite photos), or tabular data linked by location.
Maps are not static-they can be updated in real time with live feeds, such as traffic conditions or weather systems. A city planner tracking flood zones during a storm might overlay rainfall data from sensors onto a base map of drainage infrastructure. This allows immediate assessment of risk areas and faster deployment of emergency resources.
At its core, an arc gis map functions by combining spatial data with a visual layering engine. The process begins with importing datasets-shapefiles, GeoJSON, KML, or database tables with geometry fields. Each dataset is assigned a CRS and rendered on-screen using symbology rules.
Symbology determines how features appear: a river might be shown as a blue line with varying thickness based on flow rate, while residential zones could be shaded in light gray with boundaries drawn in black. Users can apply classification schemes-such as equal interval, quantile, or natural breaks-to group values and show differences across regions.
Advanced functionality includes geoprocessing tools. For instance, a buffer analysis around a proposed factory site can identify homes within 500 meters, helping assess potential noise or air quality impacts. These operations run behind the scenes but visibly alter the map's output. Results can be exported as PDFs, web maps, or embedded into dashboards.
There are several common types of arc gis maps, each tailored to specific tasks:
| Type | Use Case | Example |
|---|---|---|
| Thematic Map | Shows distribution of a variable across space | Population density by census tract in Los Angeles |
| Topographic Map | Displays terrain features using contour lines and shading | USGS-style map of the Grand Canyon with elevation bands |
| Web Map | Interactive map shared online via browser | Real-time wildfire tracker hosted on ArcGIS Online |
| 3D Map | Visualizes terrain and structures in three dimensions | City model of Seattle showing building heights and shadows |
Thematic maps are especially common in public health reporting. During the 2020 pandemic, state health departments used arc gis maps to display infection rates per county, enabling policymakers to allocate testing sites where demand was highest. These maps were updated daily and accessible through public portals.
One lesser-known feature is changing labeling. Instead of placing labels manually, the system calculates optimal placement based on screen resolution, zoom level, and label priority. This prevents overlapping text even when viewing a dense urban area at high zoom.
Many assume that an arc gis map is simply a digital version of a paper map. That's incorrect. While both show location-based information, arc gis maps are analytical tools. They support queries like "Which schools are within 1 km of a major highway?" and return results based on spatial logic-not just visual inspection.
A key distinction: arc gis map refers to the visual output, not the software itself. You can have an arc gis map made in QGIS or Mapbox-but only when built with ArcGIS software does it carry the full set of Esri's geoprocessing, metadata management, and publishing features.
In 2022, researchers at the University of California, Berkeley, used an arc gis map to study urban heat islands in Oakland. They combined satellite-derived surface temperature data (from Landsat 8 thermal bands) with land cover classifications (impervious surfaces, vegetation, water).
They applied a classification algorithm to group pixels into temperature categories: cool (<25°C), moderate (25–30°C), hot (30–35°C), and very hot (>35°C). The resulting map revealed that neighborhoods with low tree canopy coverage and high pavement density consistently exceeded 35°C during summer afternoons.
The team then overlaid demographic data-median household income, age distribution-and found that low-income communities were disproportionately affected. This evidence supported a city initiative to plant 10,000 trees in high-risk zones. The arc gis map served as both scientific tool and advocacy asset.
I've personally used arc gis pro to create similar maps for a local conservation group. We tracked invasive species spread across riparian corridors. By comparing annual field survey data with historical imagery, we identified new infestations early and coordinated targeted removal efforts. The map wasn't just informative-it guided action.
While other GIS platforms exist, arc gis pro stands out due to its integration with the broader ArcGIS system. It supports advanced scripting via Python, automated workflows through ModelBuilder, and direct publishing to ArcGIS Online.
For example, a utility company might use arc gis pro to build a map showing power line routes, maintenance records, and storm damage reports. When a hurricane hits, the system can automatically update the map with outage data from field crews, triggering alerts for repair teams based on proximity and severity.
For smaller tasks, such as plotting local park locations or analyzing neighborhood walkability, simpler tools may suffice. But when precision, compliance, and long-term data management matter-arc gis map becomes essential.
Understanding what an arc gis map is starts with recognizing it as a living, analytical interface-not just a picture. It turns raw coordinates into insight, supports decision-making across sectors, and evolves with new data. Whether used in disaster response, climate science, or city planning, the arc gis map remains a foundational tool for spatial intelligence.