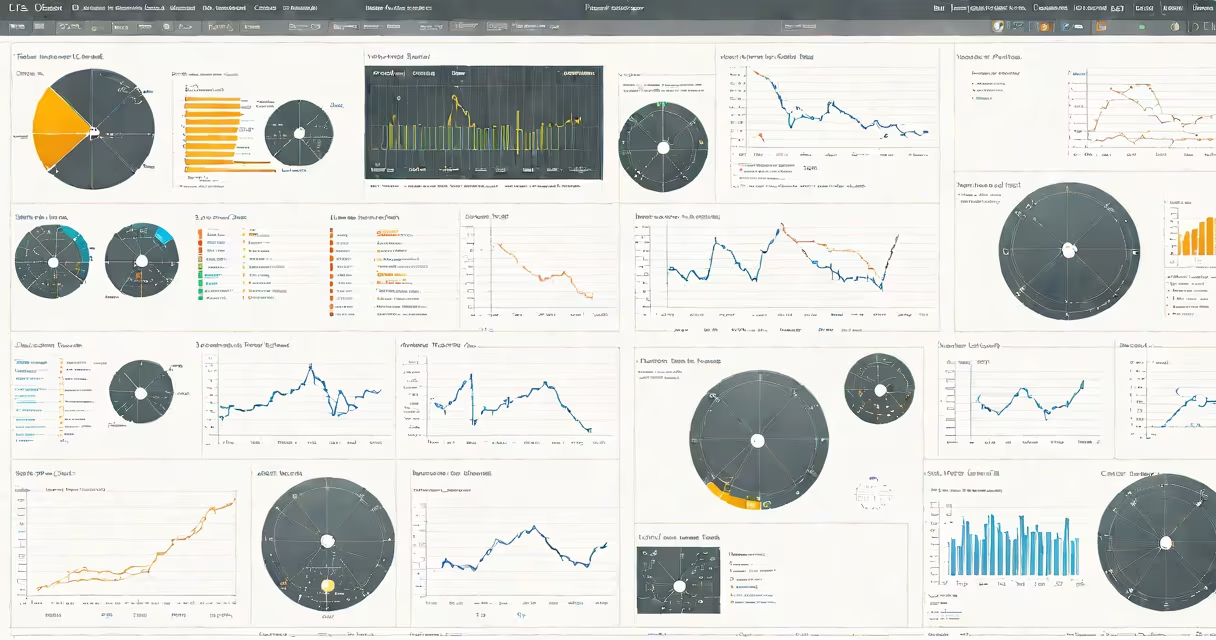
An introduction to statistics online course teaches foundational principles of data analysis, including descriptive statistics, probability, sampling, and inferential methods. These courses use real datasets and visual tools to build practical skills in interpreting numbers, identifying patterns, and making evidence-based decisions.
These courses typically cover central tendency measures like mean, median, and mode; spread metrics such as standard deviation and variance; and basic probability rules. Students learn data using tables and graphs, assess relationships between variables, and test hypotheses using significance levels. Most programs include hands-on exercises with software like Excel, R, or Python, ensuring learners apply concepts rather than just memorize formulas.
Online formats allow flexible pacing, often with video lectures, quizzes, and peer-reviewed assignments. Courses may last 4 to 12 weeks, depending on depth and target audience. Many platforms offer audit access for free, while certification requires payment. Completion provides a credential recognized by employers in fields like business, healthcare, social science, and computer science.
Introduction to statistics online courses follow a structured sequence. They begin with data types-categorical versus numerical-and then move to organizing data via frequency tables and histograms. Next, students calculate summary statistics: mean (average), median (middle value), and mode (most frequent value).
After mastering descriptive techniques, courses introduce probability theory. This includes understanding sample spaces, independent events, conditional probability, and the normal distribution. The bell curve becomes a key tool for estimating likelihoods and setting confidence intervals.
The final phase focuses on inference. Learners use sample data to estimate population parameters, such as the average income in a city. They perform hypothesis tests-like t-tests or chi-square tests-to determine whether observed differences are statistically significant or due to chance. For example, a course might ask: "Is the average test score higher in Group A than Group B?" Using a p-value threshold (commonly 0.05), students decide whether results support a claim.
Introductory courses vary by platform, duration, and focus. Some emphasize conceptual understanding; others prioritize technical application. Below is a comparison of common formats:
| Format | Duration | Tools Used | Best For |
|---|---|---|---|
| Self-Paced | 6-12 weeks | Excel, Google Sheets | Beginners needing flexibility |
| Guided | 4-8 weeks | R, Python, SPSS | Those pursuing data science or research |
| Certification Track | 12-16 weeks | Statistical software, Jupyter notebooks | Students seeking credentials for job applications |
Many courses integrate real-world datasets. For instance, a module on correlation might analyze the relationship between hours studied and exam scores using actual student records from a university database. Another lesson might explore public health data to examine vaccination rates across regions.
One non-obvious distinction: not all courses teach the difference between correlation and causation. A well-designed introduction to statistics online course explicitly warns against assuming cause-and-effect from observed associations. For example, ice cream sales and drowning incidents both rise in summer-but one doesn't cause the other. A good course explains confounding variables and the need for controlled experiments.
Introduction to statistics online course content applies across disciplines. In healthcare, professionals use statistics to evaluate treatment effectiveness. A clinical trial comparing two drugs might report a p-value of 0.03, indicating less than a 3% chance the result occurred randomly. This supports rejecting the null hypothesis and concluding one drug performs better.
In business, managers rely on statistical summaries to track performance. A retail chain might analyze weekly sales data to identify seasonal trends. If average monthly revenue increased by 12% year-over-year, a course would teach how to assess whether this change is meaningful or within expected variation.
For researchers, statistical literacy prevents misinterpretation of findings. According to the American Statistical Association, nearly 40% of published studies in psychology and medicine contain errors in statistical reporting. An effective introduction to statistics online course addresses common pitfalls like p-hacking, overfitting, and ignoring effect size.
I taught a version of this course at a community college during the pandemic. I used anonymized survey data from local residents about remote work satisfaction. Students calculated means and standard deviations, created bar charts, and ran t-tests to compare responses between urban and rural participants. One group discovered a statistically significant difference in satisfaction levels (p = 0.018), which surprised them. That moment-when abstract math revealed a real insight-was the most useful teaching experience I've had.
People often mistake statistics for mathematics. While both involve numbers, statistics focuses on uncertainty and decision-making under incomplete information. Mathematics proves truths; statistics estimates probabilities. A single number like "mean" summarizes data, but it doesn't tell the whole story. For example, two classes can have the same average test score-say, 75-but very different distributions. One class might have all scores clustered around 75; another could have half scoring below 50 and half above 90. Without seeing the spread, the mean gives a misleading picture.
Another frequent error: equating statistical significance with practical importance. A study might find a new drug reduces recovery time by 0.8 days (p = 0.04), meeting significance criteria. But clinicians may consider a 0.8-day improvement too small to justify side effects or cost. A solid introduction to statistics online course emphasizes effect size and confidence intervals alongside p-values.
Some courses assume prior math knowledge. However, reputable programs start from basics. For example, Khan Academy's introductory course begins with counting and fractions before introducing variance. MIT OpenCourseWare's Statistics for Applications assumes only high school algebra. Both provide clear explanations and step-by-step problem solving.
Finally, not all online courses are equal. Look for ones developed by accredited institutions or organizations like the American Statistical Association or Coursera's partner universities. Check syllabi for coverage of bias, ethical data use, and reproducibility. Avoid programs that skip critical topics like sampling error or multiple comparisons.
Understanding data is essential in a world driven by information. An introduction to statistics online course builds the foundation for reading news reports, evaluating scientific claims, and making informed personal and professional choices. tracking disease outbreaks, statistical reasoning turns raw numbers into actionable insight.
Start with a course that covers data visualization, probability, and hypothesis testing. Use real datasets to practice interpreting results. Build the habit of asking: "What's the sample size? Is this difference likely due to chance? Who collected the data and why?" These habits separate informed users from passive consumers of statistics.