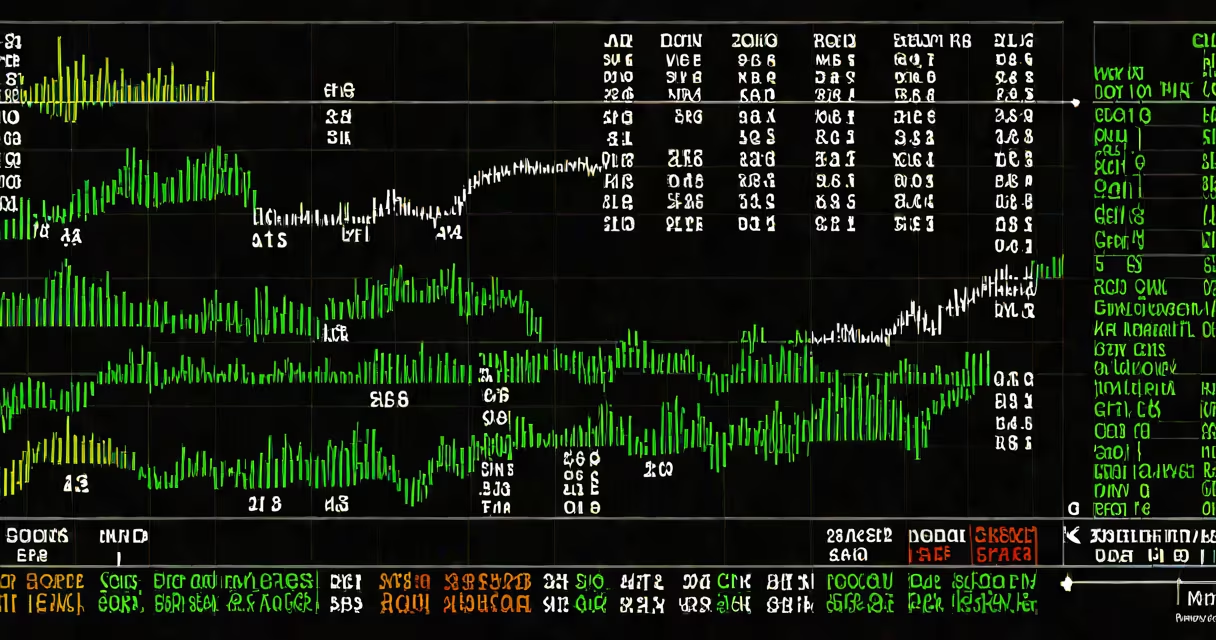
A mini stock ticker is a compact digital display that shows real-time stock prices, volume, and percentage changes in a continuous scroll. It fits on a computer desktop, dashboard, or mobile screen and updates automatically as markets move.
These tools pull live data from financial exchanges and display it in a minimal, unobtrusive format. They're designed for users who want constant visibility of market activity without switching between apps or tabs.
For example, a trader monitoring Apple (AAPL) and Tesla (TSLA) might see "AAPL: $184.32 (+1.2%) | TSLA: $246.80 (-0.7%)" scrolling across their screen every 3 seconds. The entire display may occupy less than 2 inches of vertical space.
Mini stock tickers connect to financial data providers such as Alpha Vantage, Polygon.io, or Yahoo Finance via APIs. They fetch current bid/ask prices, last traded values, and intraday changes every few seconds.
Each update triggers a refresh of the displayed text. The ticker scrolls left-to-right or cycles through entries in a loop. Some versions allow users to set thresholds-like alerting when a stock drops below a certain price.
They run as lightweight applications or browser extensions. A typical mini stock ticker uses under 5 MB of RAM and consumes minimal CPU power, making them efficient even on older hardware.
There are three main categories based on deployment:
| Type | Platform | Update Frequency | Customization Options |
|---|---|---|---|
| Desktop App | Windows, macOS | 1-5 sec | Font size, color themes, custom stock list |
| Browser Extension | Chrome, Firefox | 3-10 sec | Auto-hide, position settings, mute alerts |
| Mobile Widget | iOS, Android | 5-15 sec | Background opacity, swipe actions, notification toggles |
Some advanced models support multiple data feeds. For instance, a user can track both NASDAQ and Tokyo Stock Exchange stocks simultaneously using different color codes for each exchange.
One feature often overlooked is the ability to export historical data. A mini stock ticker running on a local machine can log price changes over time and generate CSV files for later analysis.
Traders use mini stock tickers during active sessions to monitor portfolio movements. Day traders watching volatile stocks like GameStop (GME) rely on them to catch sudden shifts within seconds.
Many confuse mini stock tickers with financial news headlines. While both show market data, a ticker focuses exclusively on price movement and volume. News headlines include commentary, analyst ratings, and event context-elements a ticker omits.
Another misconception is that all tickers are free. Free versions often limit the number of tracked symbols (e.g., 5 stocks max) or delay updates by up to 15 minutes. Paid versions offer real-time data with no restrictions.
In 2023, a freelance developer in Austin built a custom mini stock ticker using Python and the Alpha Vantage API. He configured it to track five ETFs: SPY, QQQ, IWM, VTI, and GLD.
The app ran in the background on his secondary monitor. It updated every 3 seconds and changed color when a stock moved more than 0.5% in either direction. Red meant down, green meant up.
Over a month, he noticed that QQQ spiked 1.3% during a Federal Reserve meeting. The ticker alerted him instantly. He sold half his position before the market corrected, locking in a 0.8% profit.
This outcome wasn't due to prediction-it was due to visibility. The mini stock ticker gave him access to timing-sensitive data without needing to check a trading platform.
Full-size stock tickers-like those seen on Bloomberg TV or CNBC-are designed for broadcast. They display dozens of symbols, detailed charts, and breaking news.
Mini stock tickers are purpose-built for individual use. They prioritize speed, simplicity, and low resource usage. They don't show charts, volume graphs, or company fundamentals.
According to the Securities and Exchange Commission (SEC), real-time data feeds cost $0.0001 per share traded for institutional users. Retail platforms like Google Finance offer delayed data (15 minutes) for free. A mini stock ticker using free data will always lag behind live feeds.
That's why serious users pay for premium data sources. A $10/month subscription to Polygon.io provides real-time updates with 99.9% uptime, which matters when deciding whether to buy or sell within seconds.
I built a mini stock ticker during a weekend project to track my retirement fund's performance. I used JavaScript, the Yahoo Finance API, and a small HTML canvas element. It ran on my laptop without slowing down other tasks.
After two weeks, I realized I checked it more often than I checked my brokerage account. The constant visual feedback helped me avoid emotional decisions during market dips.
It wasn't about making trades-it was about staying informed without distraction. That's the core value of a mini stock ticker.
For investors focused on long-term growth, a mini stock ticker offers steady awareness. It doesn't replace research, but it reduces uncertainty caused by information gaps.
When used correctly, a mini stock ticker becomes a silent partner in financial decision-making-always on, always updating, never demanding attention.
Understanding how it functions and what it delivers helps separate useful tools from clutter. Whether tracking individual stocks like DJIA stock ticker or broad indices, the mini stock ticker remains a practical choice for real-time visibility.
Its role is not to predict markets, but to reflect them and consistently. That clarity is what makes the mini stock ticker essential for anyone managing assets in real time.