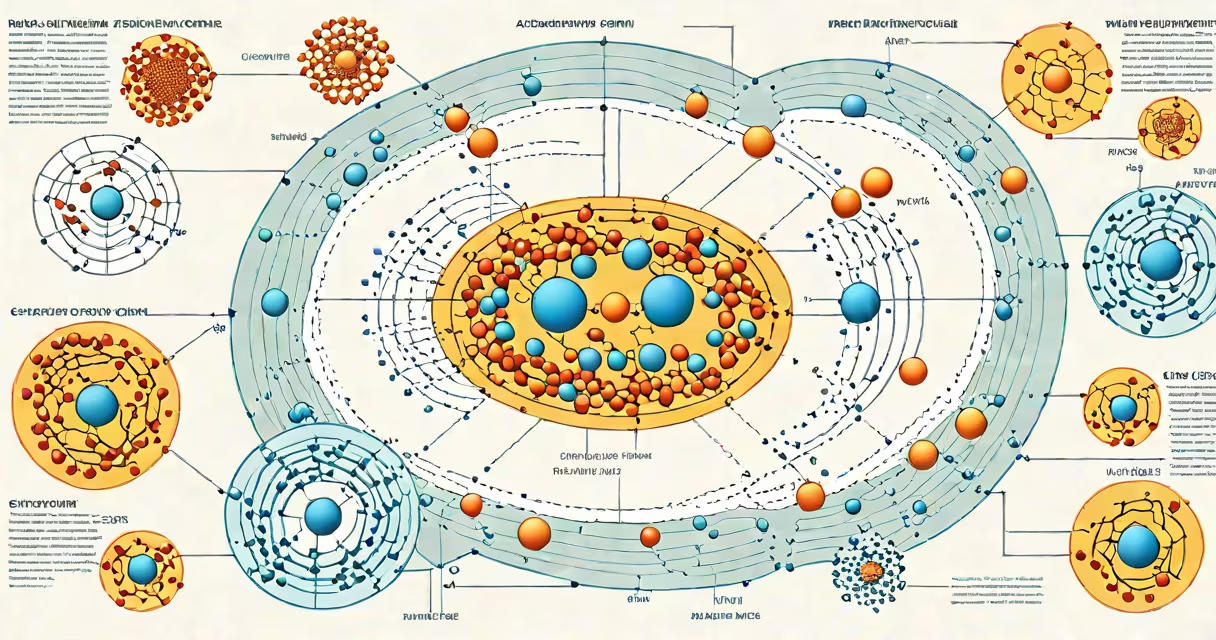
A phases of the cell cycle diagram illustrates the sequential stages a eukaryotic cell undergoes before dividing: G1 (gap 1), S (synthesis), G2 (gap 2), and M (mitosis), followed by cytokinesis. The diagram tracks DNA replication, growth, and nuclear division in a visual timeline.
The cell cycle begins in G1, where the cell grows and performs normal functions. During this phase, the cell increases in size, synthesizes proteins, and prepares for DNA replication. A checkpoint ensures conditions are favorable before proceeding. If the cell receives signals to divide, it enters the S phase.
In the S phase, DNA synthesis occurs. The cell's entire genome is duplicated, resulting in two identical sets of chromosomes. This ensures each daughter cell receives a complete copy. After S phase, the cell enters G2, where it continues growing and checks for DNA damage. The G2 checkpoint confirms replication is accurate before entering mitosis.
Mitosis-the actual division of the nucleus-consists of four sub-stages: prophase, metaphase, anaphase, and telophase. Prophase involves chromatin condensing into visible chromosomes and the breakdown of the nuclear envelope. In metaphase, chromosomes align at the cell's equator. Anaphase separates sister chromatids, pulling them to opposite poles. Telophase reforms nuclear envelopes around the separated nuclei.
Cytokinesis follows mitosis. In animal cells, a contractile ring of actin and myosin pinches the cell membrane inward, forming a cleavage furrow. In plant cells, a cell plate forms a new cell wall. The result is two genetically identical daughter cells.
| Phase | Duration | Key Events | Checkpoint |
|---|---|---|---|
| G1 | Variable (up to 10 hours) | Cell growth, protein synthesis | G1/S |
| S | ~8 hours | DNA replication | None |
| G2 | ~4 hours | Preparation for mitosis, organelle duplication | G2/M |
| M | ~1 hour | Chromosome segregation, nuclear division | M spindle |
Interphase-G1, S, and G2 combined-accounts for about 90% of the cell cycle in rapidly dividing human cells. The M phase, though brief, is highly orchestrated. Errors during mitosis can lead to aneuploidy, a sign of cancer. The diagram emphasizes timing, spatial organization, and regulatory checkpoints.
Common misconceptions include treating mitosis and cytokinesis as the same process. Mitosis divides the nucleus; cytokinesis splits the cytoplasm. Another error is assuming all cells cycle continuously. Many differentiated cells, like neurons or muscle fibers, exit the cycle permanently and enter G0, a resting state outside the cycle.
A key detail often omitted in basic diagrams is the role of cyclins and CDKs (cyclin-dependent kinases). These proteins regulate phase transitions. For example, high levels of cyclin B activate CDK1, triggering entry into mitosis. Without this molecular control, cells cannot progress safely through the cycle.
I once reviewed a student-created phases of the cell cycle diagram that showed mitosis as a single step. Correcting this revealed a deeper misunderstanding: students often compress complex events into simplified visuals. A properly labeled diagram includes distinct phases with clear markers-spindle formation in prophase, chromosome alignment in metaphase, separation in anaphase, and nuclear reformation in telophase.
For context, the diagram of rain cycle shows atmospheric water movement, while the blood-cell-diagram illustrates cellular differentiation. Both use visual sequencing, but the phases of the cell cycle diagram focuses on temporal and structural changes within a single cell.
When studying cell biology, always verify that a phases of the cell cycle diagram includes both interphase and mitotic stages. Reliable sources such as the National Center for Biotechnology Information (NCBI) and the American Society for Cell Biology (ASCB) provide standardized illustrations. The NCBI's PubMed Central offers peer-reviewed diagrams with annotations on regulatory mechanisms.
Use a phases of the cell cycle diagram to track progression, identify errors, and understand how disruptions cause disease. Cancer cells often bypass checkpoints, leading to uncontrolled division. A well-labeled diagram highlights these vulnerabilities.