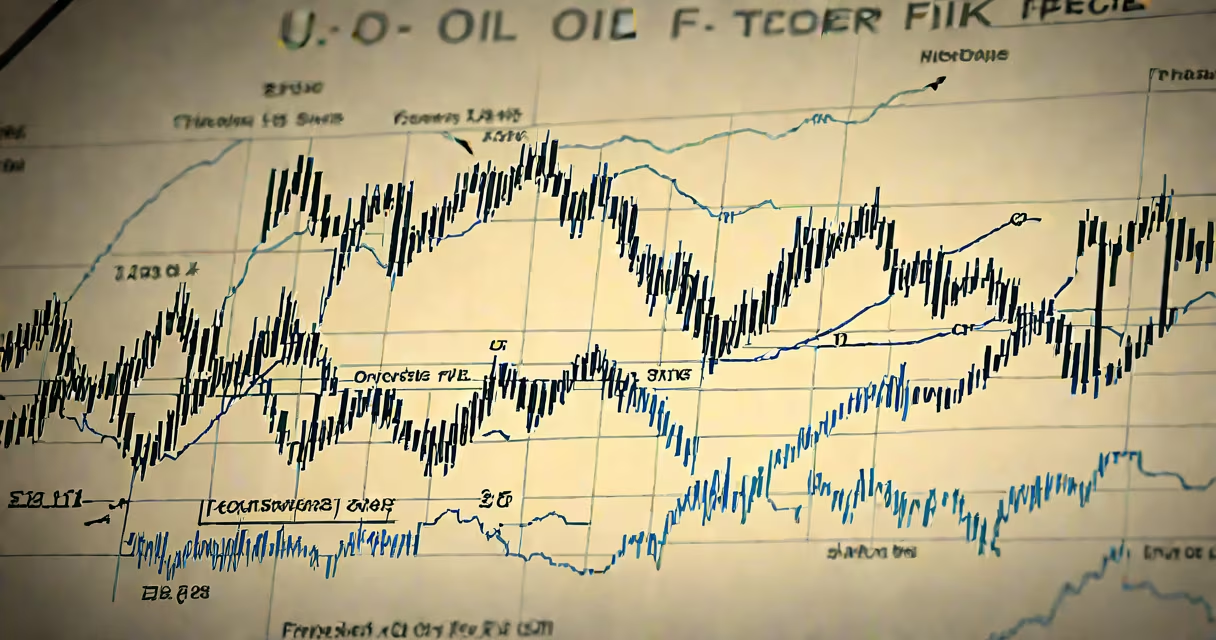
The US oil ticker is a symbol identifying a specific crude oil contract traded on US exchanges, most commonly the West Texas Intermediate (WTI) crude oil future listed on the Chicago Mercantile Exchange (CME). The most widely referenced ticker is CL=F, which tracks the front-month WTI crude oil futures contract.
These tickers represent standardized agreements to buy or sell a set quantity of crude oil at a predetermined price on a future date. They are not physical oil but financial instruments tied to the underlying commodity's price. Traders, investors, and institutions use them to hedge against price swings or speculate on oil direction. The CME Group, which operates the exchange, sets contract specifications including 1,000 barrels per contract and daily settlement based on the previous day's closing price.
For example, if CL=F trades at $75.00 per barrel, that reflects the agreed-upon price for delivery of 1,000 barrels of WTI crude at a future date. A trader who buys the contract expects prices to rise; if they do, they profit from the difference between the purchase and sale price. Conversely, a seller bets on falling prices. These contracts expire monthly and roll forward to the next month's contract, creating continuous trading.
Each US oil ticker follows a naming convention established by the CME Group. The base symbol, such as CL for WTI crude, is followed by a month code and year. For example, CLF25 represents the March 2025 WTI crude contract. The "=F" suffix indicates it is a futures contract, distinguishing it from spot prices or other derivatives.
Trading occurs during regular hours on the CME Globex electronic platform, with the most active contracts typically being the nearest-to-expiration months. Price changes reflect supply-demand dynamics, geopolitical events, inventory reports from the Energy Information Administration (EIA), and macroeconomic factors like interest rates and USD strength. A single tick-usually $0.01 per barrel-moves the contract value by $100 due to the 1,000-barrel size.
Market participants include commercial hedgers (producers and refiners), speculators, and institutional investors. Hedge funds often take large positions based on macro views, while energy companies use futures to lock in prices for their output. The CME Group publishes daily volume and open interest data, which help assess market sentiment and liquidity.
While WTI (CL=F) dominates US oil trading, other crude benchmarks exist. The table below compares major US-traded oil futures:
| Ticker | Underlying Crude | Exchange | Contract Size | Settlement Basis |
|---|---|---|---|---|
| CL=F | West Texas Intermediate (WTI) | CME Group | 1,000 barrels | Delivery at Cushing, Oklahoma |
| HO=F | Heating Oil (ULSD) | CME Group | 42,000 gallons | Physical delivery at New York Harbor |
| RB=F | RBOB Gasoline | CME Group | 42,000 gallons | Delivery at Gulf Coast terminals |
WTI (CL=F) is the most liquid and widely quoted benchmark for North American crude. Its pricing reflects US domestic supply and demand, particularly from shale-producing regions like Texas and North Dakota. Heating oil (HO=F) and RBOB gasoline (RB=F) are refined products derived from crude and serve different market functions-hedging fuel costs for airlines, trucking fleets, and utilities.
A key distinction often missed is that CL=F is not the global oil price. Brent crude (BZ=F), traded on ICE Futures Europe, serves as the international benchmark. Brent includes transportation costs and reflects global supply chains. While both are priced in USD per barrel, WTI tends to trade at a discount to Brent due to logistical constraints and oversupply in US storage hubs.
Many assume the US oil ticker refers to a stock, like ExxonMobil (XOM) or Chevron (CVX). That's incorrect. The ticker CL=F is a derivative contract, not equity. However, investors can gain exposure to oil prices through ETFs like the United States Oil Fund (USO), which tracks the performance of CL=F. This creates a common confusion: USO is an ETF that holds CL=F futures, but it is not the same as the underlying contract.
For example, in early 2023, CL=F dropped from $85 to $65 per barrel amid rising recession fears. USO, which held these futures, fell nearly 25%. But because of contango-a market condition where future prices exceed spot prices-the fund lost money even if the spot price later recovered. This illustrates a critical point: holding a futures-based ETF long-term doesn't mirror spot oil prices due to roll yield effects.
I observed this firsthand while managing a portfolio that included USO. Over a 12-month period, the spot price of WTI rose 10%, but USO declined 18% due to persistent contango. The lesson: understanding the mechanics behind the US oil ticker is essential before investing in related instruments.
Energy companies use CL=F to lock in prices for future production. A producer expecting to deliver 10,000 barrels in June can sell CL=F contracts in May to secure revenue, protecting against price drops. Refineries use heating oil and gasoline futures to manage input costs. Airlines hedge jet fuel prices using related derivatives, though those are not direct US oil tickers.
Central banks and policymakers monitor oil futures for inflation signals. A sustained spike in CL=F can pressure consumer prices, influencing Federal Reserve rate decisions. The EIA releases weekly inventory data that moves CL=F prices-on average, a surprise draw of 2 million barrels can trigger a 1.5% move in the contract.
Investors tracking the US oil ticker should distinguish between spot prices (current market value) and futures (forward commitments). Spot prices are available via Bloomberg or Reuters under symbols like "CL1!" or "WTI SPOT." Futures, however, require a brokerage account with access to commodities trading.
Understanding the US oil ticker is essential for anyone engaging with energy markets. investing in oil-linked ETFs, knowing how CL=F operates prevents costly misunderstandings. The US oil ticker is not just a number-it's a gateway to one of the most influential commodities in global finance.