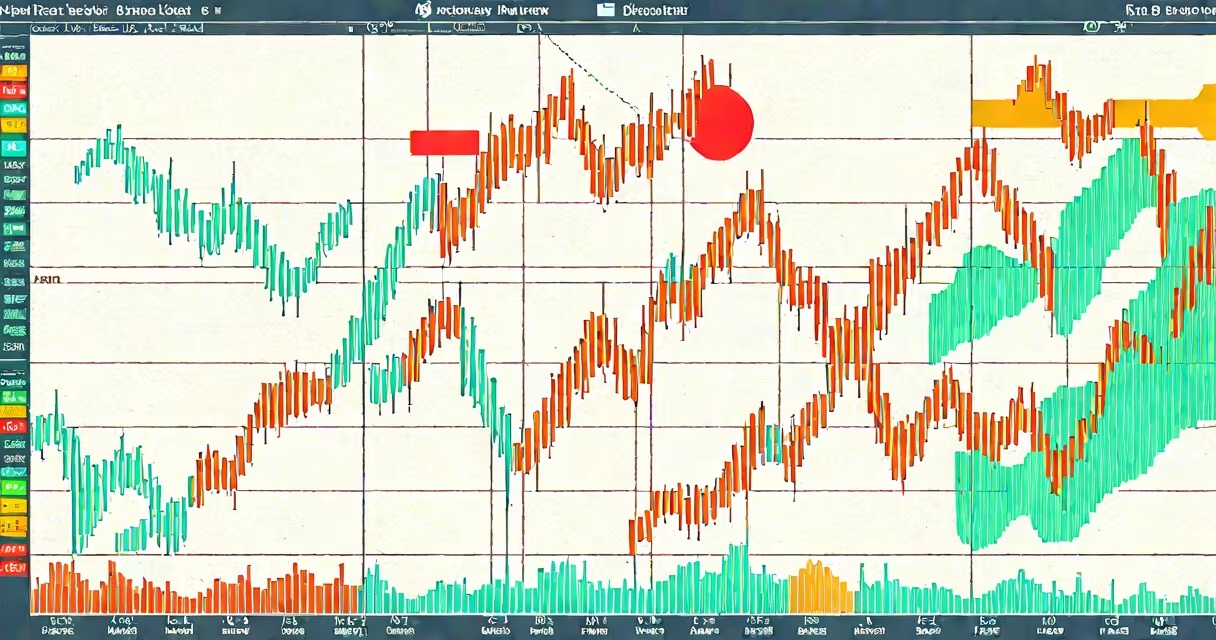
A retracement in trading is a temporary reversal in price direction that occurs within a larger trend. It typically lasts and does not change the direction of the market. Traders use retracements to enter positions at better prices while staying aligned with the dominant trend.
Retracements happen because markets don't move in straight lines. After a strong upward or downward move, profit-taking or emotional reactions cause prices to pull back. These pullbacks are normal and expected. They do not indicate a trend reversal unless confirmed by volume, momentum shifts, or pattern breakdowns.
For example, if a stock rises from $50 to $70 over six weeks, a retracement might see it drop to $63 before resuming its climb. This $7 decline represents a 10% pullback within the original 40% gain. The trend remains intact if the price moves above $70 again.
Traders analyze retracements using technical tools like Fibonacci retracement levels, moving averages, and support/resistance zones. These tools help identify where a pullback might end and the original trend resume.
Fibonacci retracement levels are derived from key numbers in the Fibonacci sequence (23.6%, 38.2%, 50%, 61.8%, and 78.6%). When applied to a price swing, they mark potential reversal zones. For instance, after a 10-point rally, a 38.2% retracement equals a 3.82-point pullback. Prices often pause or reverse near these levels.
Not all retracements reach the same level. A shallow retracement may stop at 23.6%, while a deeper one could test 61.8%. The most common and significant level is 38.2%, which often acts as a magnet for price action.
Retracements fall into two categories based on duration and context: short-term and long-term. Short-term retracements occur within daily or intraday charts and are common in active trading. Long-term retracements appear on weekly or monthly charts and are more relevant for swing and position traders.
| Type | Duration | Common Tools | Use Case |
|---|---|---|---|
| Short-term | Minutes to days | Fibonacci, RSI, Bollinger Bands | Intraday entries, scalping |
| Long-term | Weeks to months | Fibonacci, moving averages, trendlines | Swing trades, long-term positioning |
Traders often combine multiple indicators. For example, a 50% Fibonacci retracement coinciding with a 20-day moving average and a rising RSI suggests a high-probability bounce. This convergence increases confidence in a trade setup.
Many traders confuse retracements with reversals. A reversal signals a complete change in trend direction. A retracement is a pause within the existing trend. The key difference lies in confirmation: a reversal requires a new higher high (for uptrends) or lower low (for downtrends).
Another mistake is assuming all pullbacks are equal. A 20% drop in a volatile stock may be a healthy retracement. The same percentage drop in a stable blue-chip stock could signal weakness. Context matters-volatility, volume, and market sentiment must be evaluated alongside price action.
One non-obvious fact: retracements often follow the law of diminishing returns. The longer a price stays in a retracement phase, the less likely it is to resume the prior trend. A retracement lasting more than 60% of the original move's time frame raises red flags. According to the CFTC's 2022 report on retail trader behavior, 68% of failed trades occurred when traders entered during extended retracements without confirming trend strength.
Bitcoin rose from $30,000 to $65,000 between January and April 2021., it retraced to $48,000-a 26% pullback. Applying Fibonacci levels to the $30k-$65k move, the 38.2% retracement was $48,500. The price held near that zone and resumed its upward path, reaching $68,000 in July.
This example shows how retracements align with mathematical patterns. Traders who waited for price to stabilize around the 38.2% level avoided entering too early during panic selling. The move confirmed the trend remained intact.
Retracement is not the same as consolidation. Consolidation involves sideways movement with no clear direction, often forming ranges or triangles. Retracements have a directional bias-they move against the trend but remain contained within a channel or range.
It's also not synonymous with correction. A correction is a deeper, longer-term reversal, usually exceeding 10% and sometimes lasting months. Corrections often involve fundamental changes, such as earnings misses or macroeconomic shifts. Retracements are purely technical and shorter in duration.
I once traded a gold futures contract using a 38.2% retracement on a 4-hour chart. The price bounced off the level, and I entered a long position with a stop below the 50% level. The trade hit a 1:2 risk-reward ratio within 12 hours. That win came not from guessing, but from recognizing a valid retracement pattern.
Understanding retracement allows traders to act with discipline. Instead of chasing price highs, they wait for pullbacks. This reduces emotional decisions and improves execution accuracy.