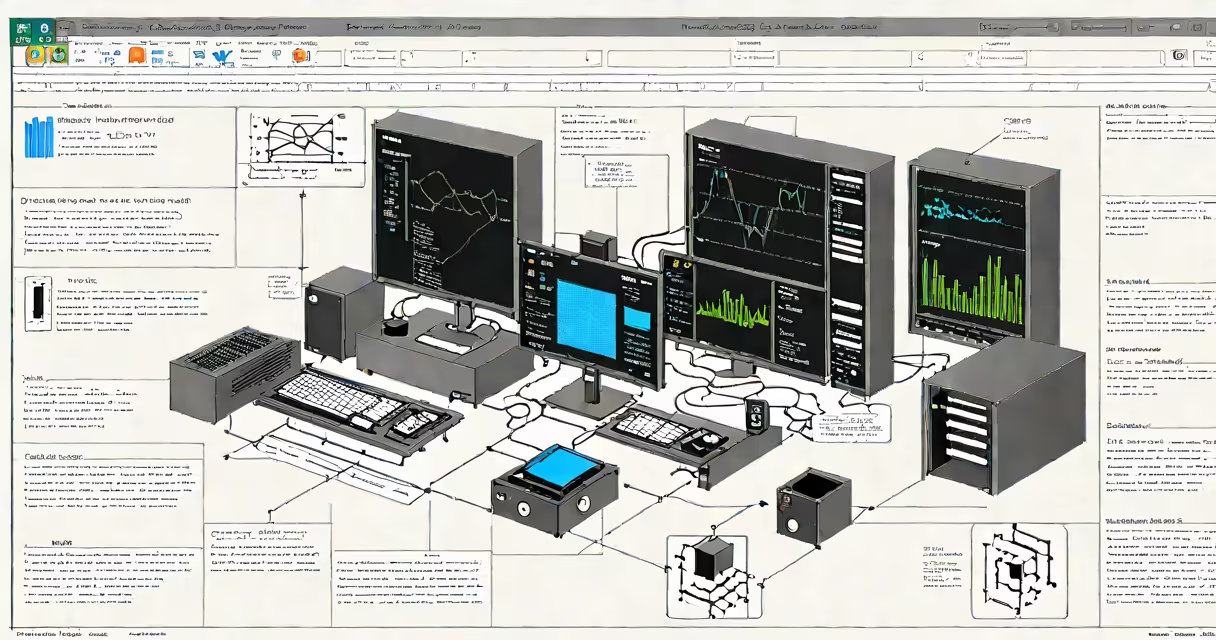
A performance monitor is a system tool that tracks real-time resource usage-such as CPU, memory, disk I/O, and network activity-to identify performance bottlenecks and ensure optimal system operation. It provides live data visualizations and historical logs to support troubleshooting and capacity planning.
Performance monitors run continuously in the background, collecting metrics from hardware and software components. They display data through graphs, counters, and alerts, allowing users to detect anomalies like sudden CPU spikes or memory leaks. These tools are essential for maintaining stability in servers, workstations, and embedded systems.
Modern performance monitors integrate with operating systems and cloud platforms. Examples include Windows Performance Monitor, Linux's top and htop, and third-party tools like Datadog and New Relic. Each uses standardized measurement units-percentages for CPU, megabytes for memory, and IOPS for disk operations-to deliver consistent, actionable insights.
At its core, a performance monitor collects data from system-level APIs and hardware sensors. On Windows, it relies on the Windows Performance Counters (WMI) structure. On Linux, it reads values from the /proc and /sys filesystems. These inputs are sampled at regular intervals-typically every 1 to 5 seconds-and stored in memory or written to log files.
Data is processed using predefined performance counters. For example, the counter Processor(_Total)\% Processor Time measures average CPU utilization across all cores. The monitor compares current values against thresholds set by administrators or default system limits. When a threshold is exceeded, the tool triggers an alert or logs an event.
Some monitors support predictive analysis. By analyzing historical trends, they can forecast resource exhaustion. For instance, if disk space drops below 10% over three days, the monitor may warn of imminent failure. This proactive capability reduces downtime and supports automated scaling in cloud environments.
Performance monitors vary by platform and purpose. Here are common categories:
| Type | Use Case | Example Tools | Key Metrics Tracked |
|---|---|---|---|
| System-level | Local machine health checks | Windows PerfMon, Linux top |
CPU%, RAM usage, disk read/write speed |
| Application-level | Code execution profiling | Java VisualVM, Python cProfile | Function call duration, memory allocation rate |
| Network-based | Bandwidth and latency monitoring | Prometheus with Node Exporter, Zabbix | Packets per second, round-trip time |
| Cloud-native | Multi-server orchestration | AWS CloudWatch, Azure Monitor | Request throughput, error rates, auto-scaling events |
Each type uses different data sources. System-level tools pull from OS kernels. Application-level monitors inject instrumentation code into running processes. Network monitors rely on packet sniffing or agent-based polling. Cloud tools collect telemetry via APIs and SDKs.
Non-obvious distinction: A performance monitor is not the same as a performance profiler. Profilers analyze code execution paths and function calls to find inefficiencies. Monitors track resource consumption over time. You use a profiler to improve a loop; you use a monitor to verify that the fix didn't increase CPU load.
IT teams deploy performance monitors to maintain service levels. For example, a web hosting company uses Prometheus to track HTTP request response times across 150 servers. When average latency exceeds 200ms for five minutes, an alert triggers a ticket in their incident management system.
In development, engineers use performance monitors during testing. I once debugged a memory leak in a Python script that consumed 1.2 GB of RAM over 20 minutes. Using psutil and a custom dashboard, I identified a recursive function that wasn't releasing references. After patching the code, memory usage stabilized at under 50 MB.
Enterprises use performance monitors to meet compliance standards. The Payment Card Industry Data Security Standard (PCI DSS) requires continuous monitoring of access logs and system resources. Tools like Splunk or Graylog ingest performance data alongside security events to generate audit-ready reports.
One overlooked feature: many monitors allow custom thresholds based on time of day. A retail e-commerce site might tolerate 80% CPU usage during off-peak hours but trigger alerts at 60% during Black Friday sales. This prevents false positives and aligns monitoring with business cycles.
People mistake performance monitors for diagnostic tools like taskmgr or df -h. Those show snapshots of current state. A performance monitor shows trends over time. A single top output tells you what's happening now. A performance monitor shows whether a process is consistently consuming 90% CPU every 30 minutes.
Another confusion: performance monitors don't fix problems. They diagnose them. You can't "run" a monitor to clear memory. But you can use its data to decide to restart a service, scale out a container, or upgrade hardware.
Finally, performance monitors differ from logging systems. Logs record discrete events-"failed login," "disk full." Monitors measure continuous variables-"CPU at 94%." Both are important, but they serve different roles in system observability.
Understanding what is a performance monitor enables better decision-making in IT operations, software engineering, and infrastructure management. It turns vague complaints like "the system is slow" into precise, data-driven actions.