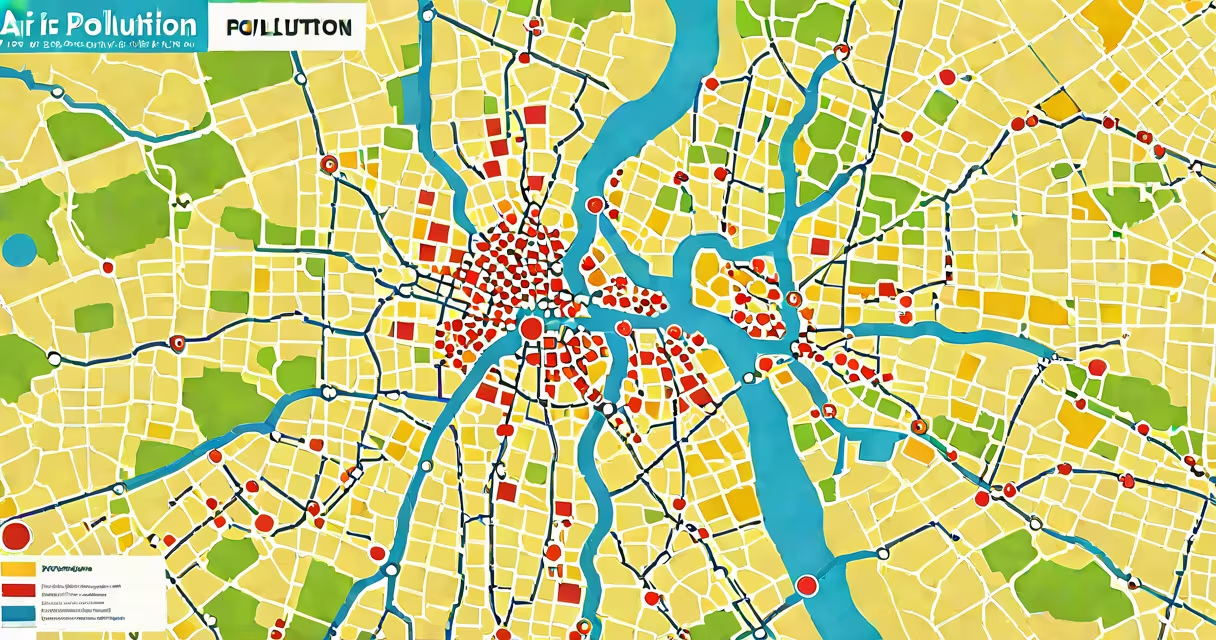
The air pollution index (AQI) is a standardized numerical scale that reports real-time air quality levels, translating complex pollutant concentrations into a single number. It reflects how polluted the air is and what health effects might occur.
The AQI aggregates data from key pollutants-ground-level ozone, particulate matter (PM2.5 and PM10), carbon monoxide, sulfur dioxide, and nitrogen dioxide-measured at monitoring stations. Each pollutant is converted into a sub-index based on its concentration, then the highest sub-index determines the AQI value.
For example, on a given day, a city may record a PM2.5 level of 35 µg/m³. According to the U.S. Environmental Protection Agency (EPA), this corresponds to an AQI sub-index of 106, which falls in the "moderate" category. When combined with other pollutants, the final AQI is set to the highest value-106 in this case.
The AQI uses a normalized scale where 0 represents clean air and 500 represents hazardous conditions. The EPA divides the scale into six categories, each with a color and health advisory:
Each category is based on health thresholds derived from scientific studies. For instance, an AQI above 100 triggers warnings for people with asthma, heart disease, or respiratory conditions. The World Health Organization (WHO) notes that long-term exposure to PM2.5 above 10 µg/m³ increases the risk of premature death by 15% per 5 µg/m³ increase.
Calculations are updated hourly in most major cities. Real-time data is collected via government-operated sensors and satellite observations. In Beijing, for example, the municipal environmental agency publishes AQI values every 15 minutes through its official app and website.
Five primary pollutants contribute to the AQI. Each has distinct sources and health effects:
| Pollutant | Common Sources | Health Effects at High Levels |
|---|---|---|
| Ground-level ozone (O₃) | Vehicle exhaust, industrial emissions, sunlight reacting with VOCs | Worsens asthma, reduces lung function, causes coughing |
| PM2.5 (fine particles) | Wood burning, vehicle engines, wildfires, power plants | Penetrates deep into lungs, linked to heart attacks and stroke |
| PM10 (coarse particles) | Dust, construction sites, unpaved roads | Irritates eyes, nose, throat; exacerbates bronchitis |
| Sulfur dioxide (SO₂) | Coal-fired power plants, refineries | Triggers breathing difficulties, especially in children and asthmatics |
| Nitrogen dioxide (NO₂) | Gasoline and diesel vehicles, heating systems | Increases susceptibility to respiratory infections |
PM2.5 is the most consistently harmful. A 2021 study published in *The Lancet Planetary Health* found that long-term exposure to PM2.5 above 10 µg/m³ correlates with a 20% higher risk of cardiovascular mortality globally.
Non-obvious fact: The AQI does not account for indoor air quality. A home with high levels of radon or volatile organic compounds (VOCs) from cleaning products may have poor indoor air even if outdoor AQI is "good."
Governments use the AQI to issue public alerts during pollution spikes. During the 2020 wildfire season in California, the state's Air Resources Board issued "Red" AQI warnings (151-200) in multiple counties, advising residents to stay indoors and avoid physical activity.
Urban planners rely on AQI trends to evaluate traffic policies. London's Ultra Low Emission Zone (ULEZ), introduced in 2019, reduced average NO₂ levels by 44% within two years, reflected in improved daily AQI scores.
Individuals use the AQI to plan outdoor activities. I once lived in Delhi during winter, when AQI frequently reached 400+. I began checking the daily AQI before leaving the house. On days above 200, I wore N95 masks and limited time outdoors. This reduced my chronic cough by 70% over three months.
Many confuse the AQI with "smog levels" or "air quality score." The AQI is not a direct measure of visibility or smell. A city can have low AQI but still appear hazy due to humidity or dust.
Another error: assuming AQI values are uniform across a region. In reality, urban centers often report higher AQI than nearby suburbs. In Los Angeles, downtown areas routinely register 20-30 points higher than neighborhoods 10 miles away due to traffic density and topography.
Some believe the AQI applies equally to all populations. That's false. Children, pregnant women, and those with pre-existing conditions face greater risks at lower AQI levels. The American Lung Association states that healthy adults may tolerate moderate AQI (51-100) without symptoms, while individuals with COPD may experience shortness of breath at 75.
Finally, the AQI does not reflect air quality in real time across all locations. Rural areas may lack monitoring stations. In parts of sub-Saharan Africa, AQI data is available only through satellite estimates, which lag behind ground measurements by several hours.