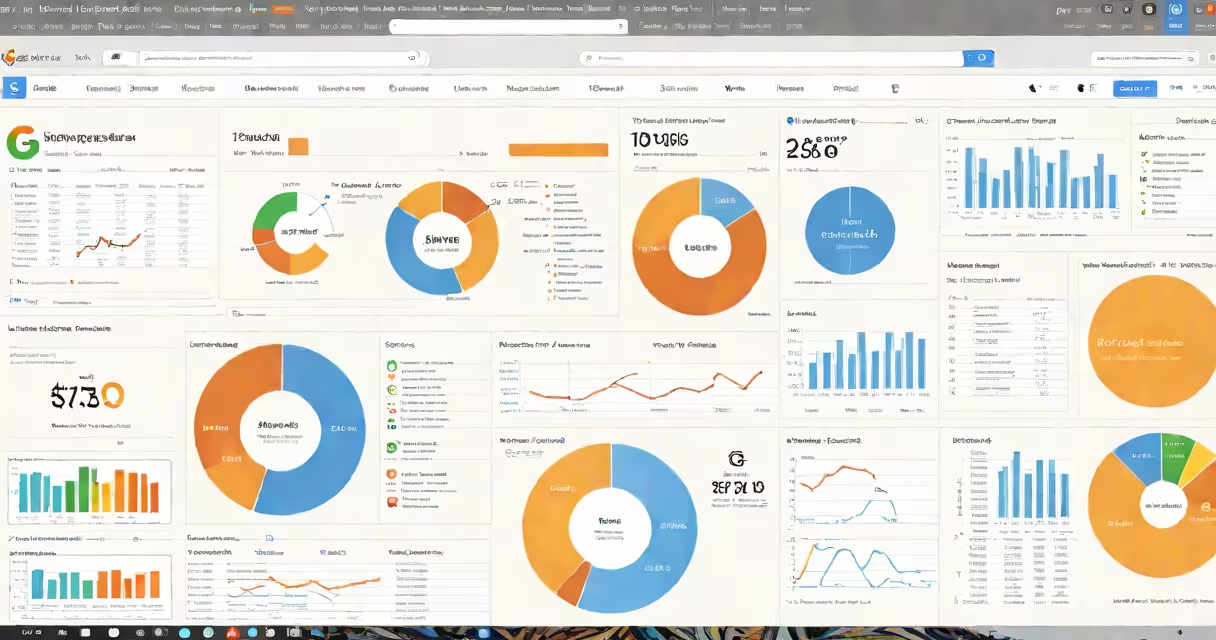
Google Analytics for business is a free web analytics service that collects, processes, and reports on website traffic and user interactions to help organizations measure performance, understand customer behavior, and improve digital strategies. It provides measurable insights into how visitors find your site, what they do once they're there, and whether they complete desired actions like purchases or form submissions.
At its core, Google Analytics for business operates by placing a JavaScript tracking code snippet on every page of your website. When someone visits your site, the script sends data to Google's servers, including details like device type, location, referral source, time spent on page, and specific actions taken. This data is then aggregated and visualized in dashboards, enabling businesses to analyze patterns over time and compare performance across campaigns, channels, and segments.
The tool supports both basic and advanced reporting. For example, it tracks unique visitors, bounce rate, average session duration, and goal completions. These metrics are essential for evaluating the effectiveness of websites, landing pages, email campaigns, and paid advertising efforts. By integrating with other Google products like Google Ads and Search Console, it offers a unified view of digital performance across multiple touchpoints.
When a visitor lands on a page with the Google Analytics tracking code, the script triggers a series of events. It captures the user's IP address (anonymized by default), browser type, screen resolution, operating system, and timestamp. It also records navigation paths-what pages were viewed, in what order, and how long each visit lasted.
Data flows into a property within your Google Analytics account, which is organized under a single account. Each property has a unique tracking ID (e.g., UA-12345678-1 or G-XXXXXXXXXX) that identifies your website. You can set up multiple properties for different domains or subdomains, such as tracking your main site and a blog separately.
Reports are generated through the Google Analytics interface, accessible via web browser or mobile app. The platform uses machine learning to detect anomalies, such as sudden drops in traffic or spikes in bounce rates, and alerts users when thresholds are breached. This enables proactive troubleshooting and rapid response to issues affecting user experience or revenue generation.
Businesses use Google Analytics for business to track conversions, identify high-performing content, segment audiences, and evaluate return on investment (ROI) for digital initiatives. For example, an e-commerce store can define "purchase" as a goal and monitor how many transactions occur per month, broken down by traffic source. If 60% of sales come from organic search, the company may invest more in SEO. If social media referrals have a higher bounce rate, it may adjust messaging or landing page design.
Advanced features include audience segmentation, custom dimensions, and event tracking. A travel agency might track clicks on "book now" buttons, even if those actions don't result in a page load. This allows measurement of engagement beyond traditional page views. Similarly, custom dimensions can capture metadata like customer tier (e.g., premium vs. standard) or campaign ID, enabling deeper analysis of user behavior across product lines.
Another useful function is funnel visualization. Suppose a SaaS company wants to reduce drop-off during sign-up. They can map out the steps-from landing page to form submission to confirmation-and see where users abandon the process. If 40% leave after entering their email, the team can test simplifying the form or adding trust signals like security badges.
| Feature | Use Case Example | Impact |
|---|---|---|
| Conversion Tracking | Measuring form submissions on a lead-generation landing page | Identified that mobile users had a 30% lower completion rate, prompting responsive redesign |
| Behavior Flow | Analyzing the path users take | Discovered that 70% of users dropped off at the shipping cost page, leading to free shipping promotion |
| Audience Segmentation | Filtering users by country and device type to tailor content | Increased engagement by 25% among mobile users in emerging markets after optimizing load speed |
Many businesses assume Google Analytics for business measures success solely by traffic volume. That's incorrect. High traffic doesn't equate to value. A site might receive 10,000 monthly visitors but convert at less than 1%. In contrast, a smaller site with 2,000 visitors and a 5% conversion rate generates more revenue. Focus should be on quality of traffic and intent behind actions-not just numbers.
Another misunderstanding is that Google Analytics automatically identifies problems. It shows symptoms-like a spike in exit rate-but doesn't diagnose causes. For example, a 75% bounce rate on a pricing page may indicate poor copy, slow loading, or mismatched expectations. Only qualitative research (e.g., user testing, surveys) can confirm the root issue.
There's also confusion between Google Analytics and Google Tag Manager. While Google Analytics collects data, Google Tag Manager manages the scripts that send data to Google Analytics. Without proper setup, tags may fire incorrectly or fail to trigger. One client I audited had misconfigured tags that recorded 80% of sessions as "direct" traffic because the referrer header wasn't being passed correctly. Fixing the tag logic restored accurate attribution.
To get meaningful results, start with clear goals. Define what success looks like-increased newsletter signups, reduced cart abandonment, or higher customer lifetime value. Then configure goals in Google Analytics to track them. Use UTM parameters in URLs to tag campaign sources, such as "utm_source=facebook&utm_medium=social&utm_campaign=spring_sale." This ensures accurate attribution in the Acquisition report.
For example, a local bakery launched a Facebook ad promoting a seasonal pastry. They used UTM tags to track clicks and conversions. After two weeks, the dashboard showed 120 clicks from Facebook, 15 completed orders, and a 12.5% conversion rate. Comparing this to past campaigns revealed that video ads drove 2.3x more conversions than static images. The team adjusted their ad spend accordingly.
Set up regular reporting. Weekly or monthly reviews help spot trends early. Use segments to isolate groups-new vs. returning visitors, desktop vs. mobile users, or geographic regions. Export data to Google Sheets or Power BI for deeper analysis. Enable data retention settings to comply with privacy laws like GDPR and CCPA.
Advanced users can use Google Analytics 4 (GA4), the latest version replacing Universal Analytics. GA4 uses an event-based model instead of session-based tracking, better supporting cross-device journeys and predictive insights. It integrates with BigQuery for large-scale data analysis, allowing SQL queries to explore user behavior at scale.
Despite its power, Google Analytics for business requires interpretation. Raw data doesn't tell stories-it needs context. Combine it with customer feedback, sales data, and market research to build a complete picture of performance. As noted by the Harvard Business Review, "Data without insight is noise."
Google Analytics for business is not a magic solution. It's a tool for measuring digital outcomes and informing strategy. Used well, it reveals where to invest, what to fix, and how to grow sustainably. The most successful teams treat it not as a dashboard, but as a conversation with their customers.
Understanding google analytics for business begins with knowing what it measures and what it doesn't. It tracks behavior, not intent. It shows patterns, not motivations. But when paired with human judgment and business goals, it becomes a critical asset for growth.