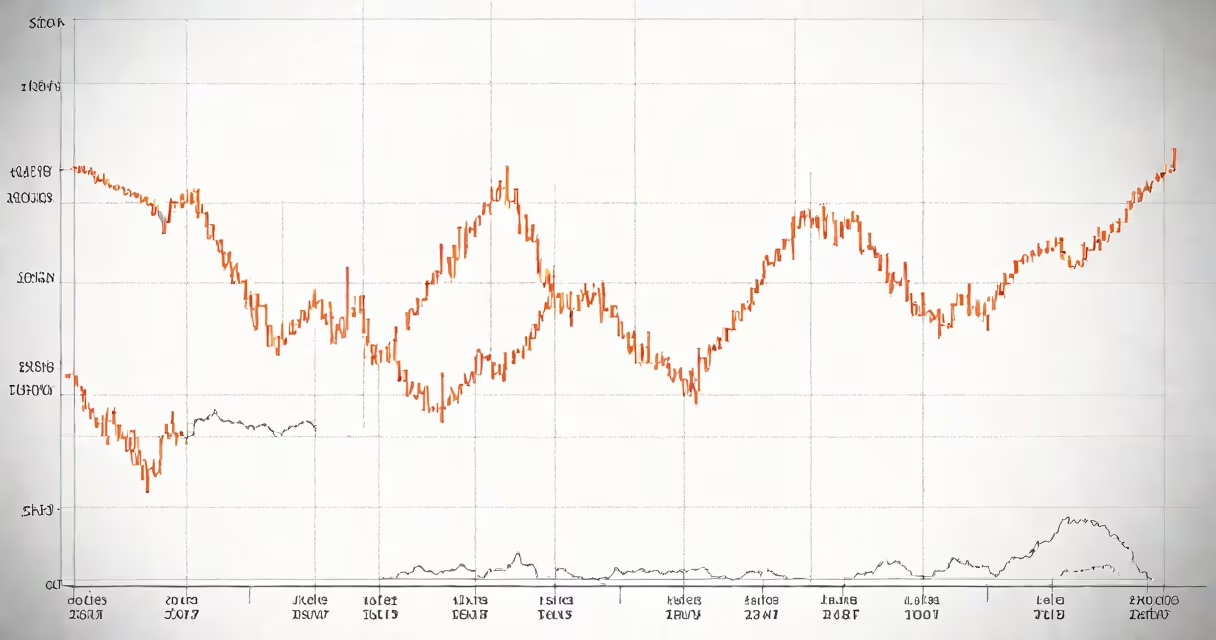
Control charts monitor process variation over time to distinguish between normal fluctuations and signals of real problems. They identify when a system is stable or when corrective action is needed, preventing defective output before it occurs.
These visual tools are central to statistical process control (SPC), a method used in manufacturing, healthcare, and service operations to maintain consistent quality. A control chart plots data points-such as product dimensions, cycle times, or defect rates-against upper and lower control limits derived from historical data. When points fall outside these limits or show non-random patterns, it indicates the process is shifting and may produce out-of-specification results.
The core function is not to detect defects after they happen, but to stop them before they occur. By signaling instability early, control charts enable teams to investigate root causes and adjust processes proactively. This reduces waste, improves yield, and ensures compliance with specifications.
Each control chart uses a centerline representing the average of past measurements. Upper and lower control limits are set at ±3 standard deviations from the mean-based on the assumption that 99.7% of random variation falls within this range under normal conditions. Points outside these limits suggest special cause variation, meaning something unusual has affected the process.
For example, a factory producing bolts measures the diameter of 50 samples per hour. The average diameter is 10.0 mm. After calculating standard deviation, control limits are set at 9.95 mm (lower) and 10.05 mm (upper). If a sample reads 10.07 mm, it exceeds the upper limit-triggering an investigation. This prevents batches of oversized bolts from being shipped.
Patterns within the limits also matter. Six consecutive points trending upward, or eight points on one side of the centerline, indicate a shift in the process even if values stay inside control limits. These signals prompt review before performance degrades further.
Different chart types match different data types and process goals. The most common are:
| Type | Data Type | Best For | Example |
|---|---|---|---|
| X-bar and R Chart | Continuous measurement (e.g., weight, length) | Monitoring averages and ranges in subgroups | Tracking average thickness of metal sheets in batches of five |
| P Chart | Proportion of defective items | Counting defect rate in fixed-size samples | Measuring % of smartphone screens with scratches in daily batches of 100 |
| C Chart | Number of defects per unit | Counting flaws when units vary in size | Tallying software bugs per release across 100 lines of code |
Choosing the right chart ensures accurate detection of issues. Using a P chart for continuous measurements leads to false alarms. Misapplication undermines reliability.
Many mistake control charts for tolerance limits or specification limits. Specification limits define acceptable product outcomes-like a bolt must be between 9.9 mm and 10.1 mm. Control limits reflect process capability and stability. A process can be in control (within control limits) but still produce defective parts if the control limits don't align with specs.
Another error is treating every point outside the control limit as a failure. Not all out-of-control signals require immediate action. Some represent natural shifts due to tool wear or material changes. Teams must analyze context-was a machine recalibrated? Was a new batch of raw material introduced?
A key insight often missed: control charts are not diagnostic tools. They flag anomalies but don't explain why they occurred. Root cause analysis follows after a signal appears. For example, a spike in call handling time at a support center triggers a control chart alert-but the team must review call logs, staffing levels, and training records to determine if the issue stems from agent fatigue or a new software bug.
In 2018, a pharmaceutical company reduced batch rejection rates by 62% after implementing control charts in tablet compression. Previously, operators adjusted machines based on visual inspection. After introducing X-bar and R charts, they detected subtle drifts in tablet weight before failing tests. Adjustments began earlier, reducing scrap and rework.
At a hospital's emergency department, tracking patient wait times using a moving range chart revealed a pattern: delays spiked every Thursday afternoon. Investigation showed understaffing during shift change. After adjusting staffing schedules, average wait time dropped from 78 minutes to 42 minutes within four weeks.
I've used control charts in a small electronics assembly line. We monitored solder joint strength across 20 daily samples. After seven days, a point exceeded the upper control limit. We traced it to a temperature fluctuation in the reflow oven. Fixing the thermostat prevented 120 defective units from being assembled. Without the chart, we'd have discovered the flaw only after shipping.
While widely adopted in production, control charts apply wherever consistency matters. In education, teachers track student test scores over time to spot learning gaps. In IT, teams monitor server response times to catch performance degradation before users complain. In finance, banks use them to detect irregular transaction patterns indicating fraud.
According to the American Society for Quality (ASQ), organizations using SPC-including control charts-report 30-50% fewer defects and 20-40% faster resolution times for process issues. The National Institute of Standards and Technology (NIST) emphasizes that control charts are foundational to achieving Six Sigma and ISO 9001 compliance, both requiring evidence of process stability.
Control charts are not optional in regulated industries. FDA guidelines for medical device manufacturing require documented evidence of process control. Failure to maintain control charts can result in audit findings and product recalls.
Understanding the purpose of control charts means recognizing their role as early warning systems. They don't replace human judgment-they improve it. By filtering noise from meaningful signals, they focus attention where it's needed most.
When you see a control chart, look beyond the lines. The real value lies in the decision-making it enables. You're not just watching numbers-you're protecting quality, safety, and efficiency.
See how control charts turn process pain into measurable improvement.